A single game can mislead you. You hang a piece, lose, and decide you are bad at tactics, when the real leak is that you never convert winning endgames. The Profile Report looks across many games at once, so what you see is the pattern, not the one bad night.
It pulls roughly your last 40 rated games from your Chess.com or Lichess account, evaluates every move with Stockfish 18 in your browser, and turns the result into one page: a Skill Profile radar at the top, then deeper sections for openings, tactics, endgames, conversion, time, consistency, and a personalised improvement plan. It is a free chess profile analysis of how you actually play.
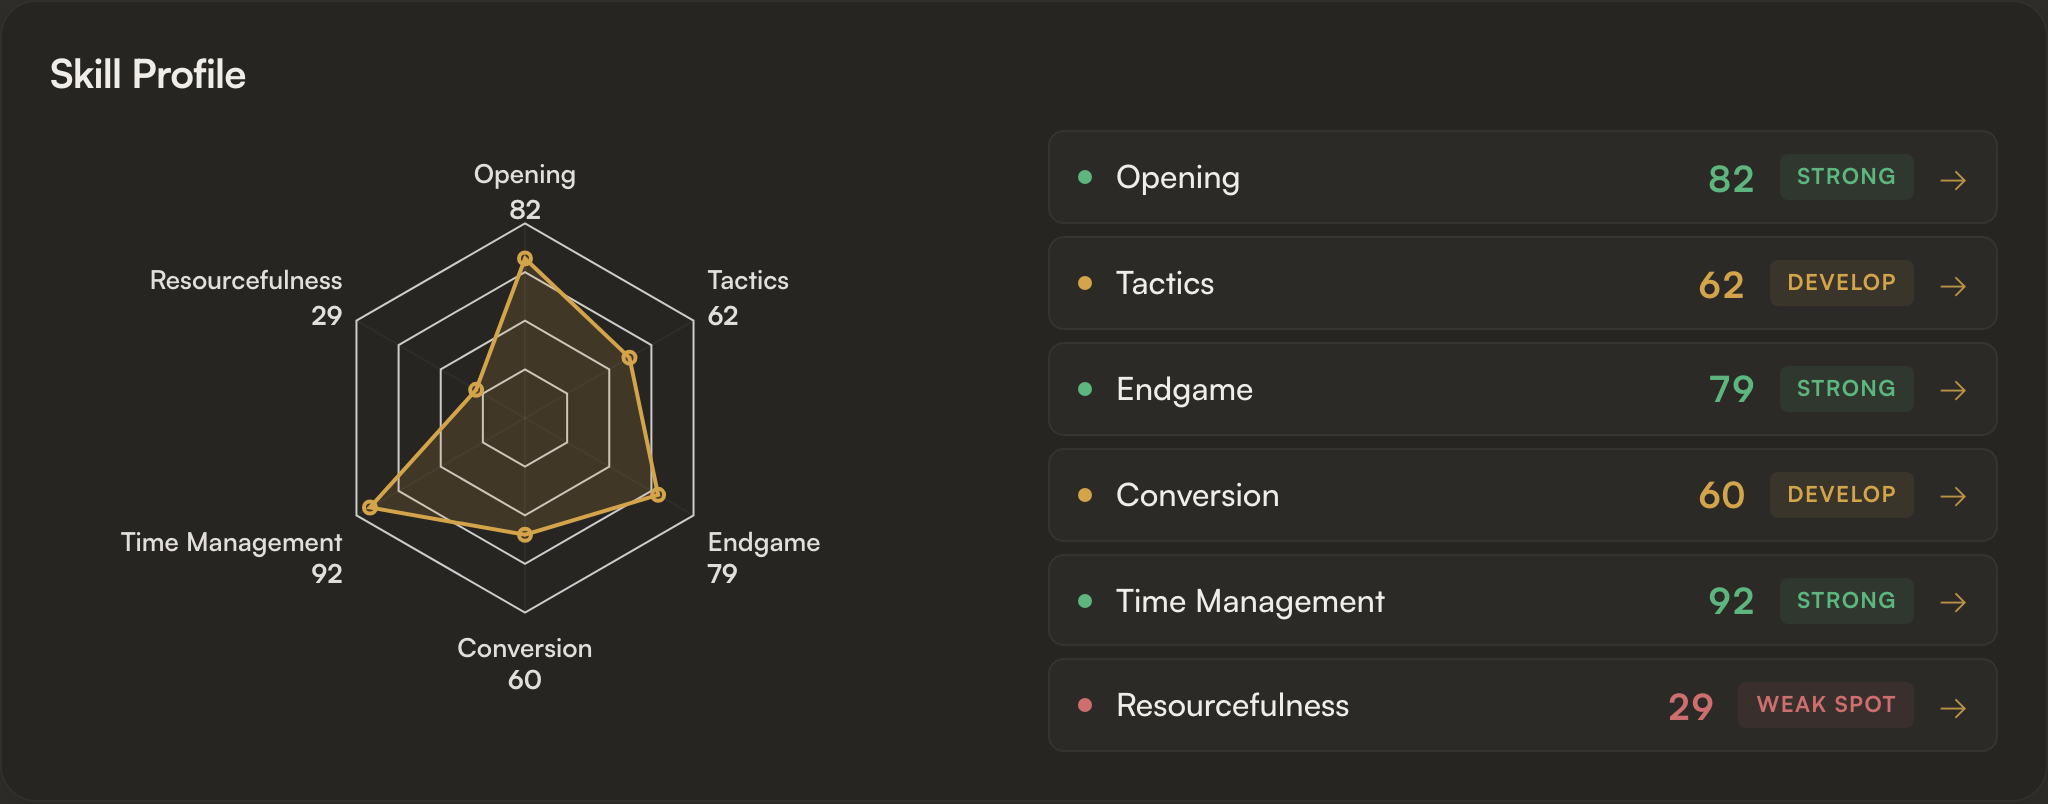
Each axis is a rating-adjusted score from 0 to 100, so it measures you against where a player at your rating usually sits. The shape of the polygon is the headline. Below the radar, every dimension is tagged Strong, Develop, or Weak spot. That is your table of contents.
Generating a report
- Open Profile Report. Enter your Chess.com or Lichess username and pick a time control: Rapid, Blitz, Bullet, or All.
- The selection screen lists your previous reports. Click any to re-open without re-running analysis.
- Hit Generate Report. A progress bar shows how many games have finished. Engine-driven sections fade in as games complete; non-engine sections (rating, openings, momentum) are ready almost immediately.
Rating & Momentum
Top-level tiles for your current rating, win rate, streak, and other summary stats.
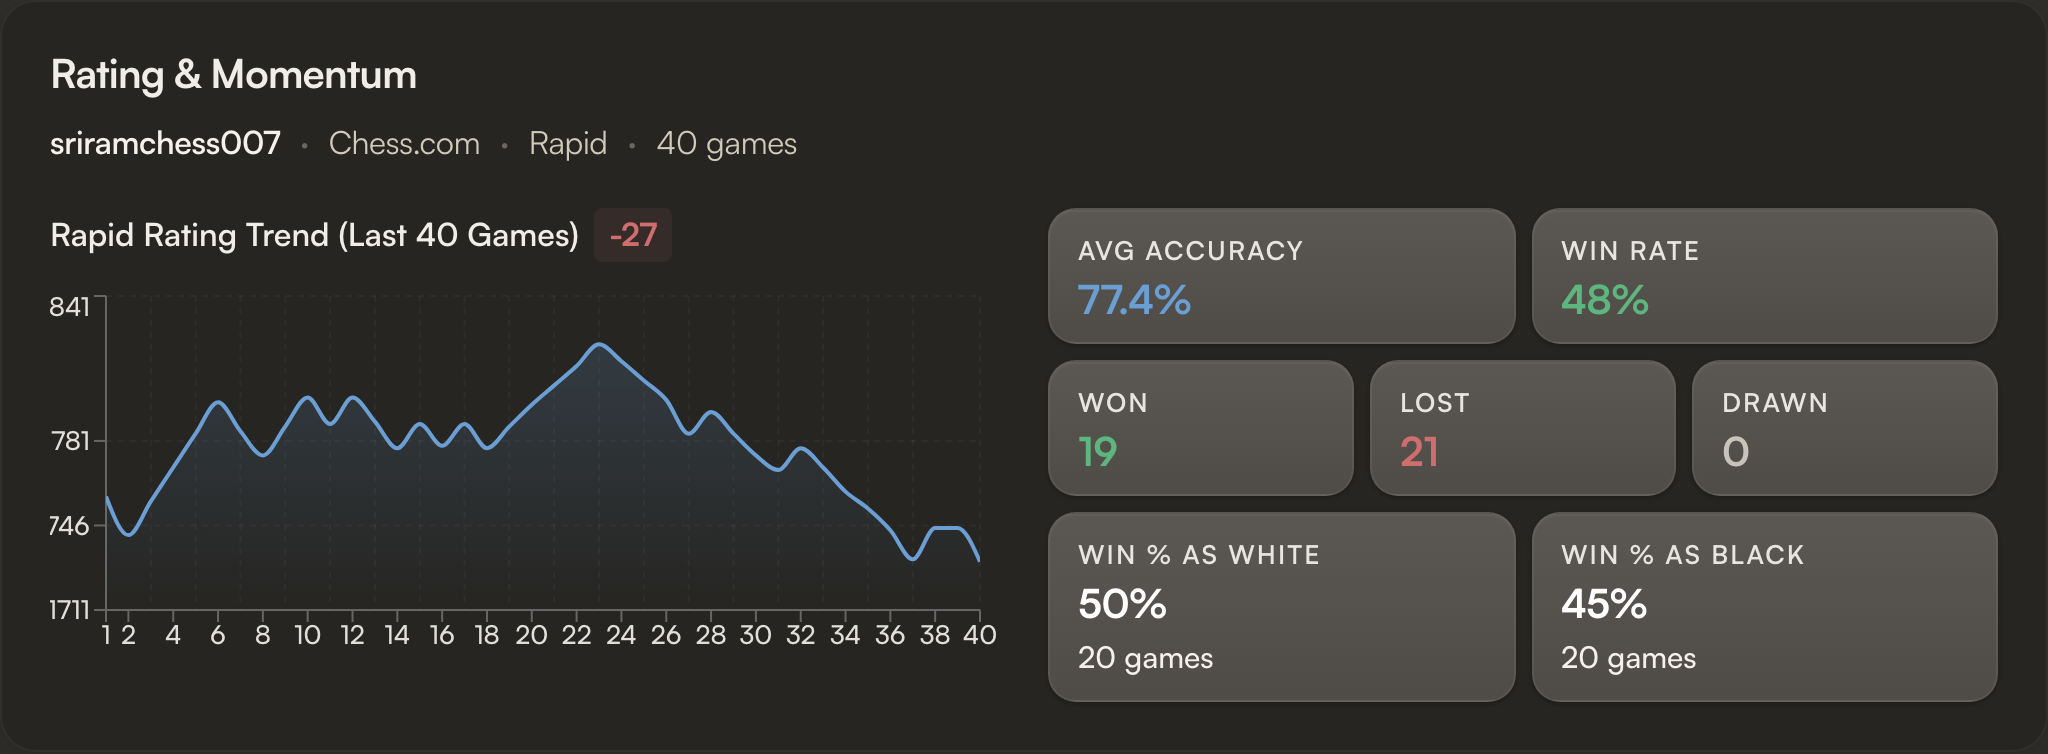
Streak goes red on losing runs, green on winning runs. No reading required.
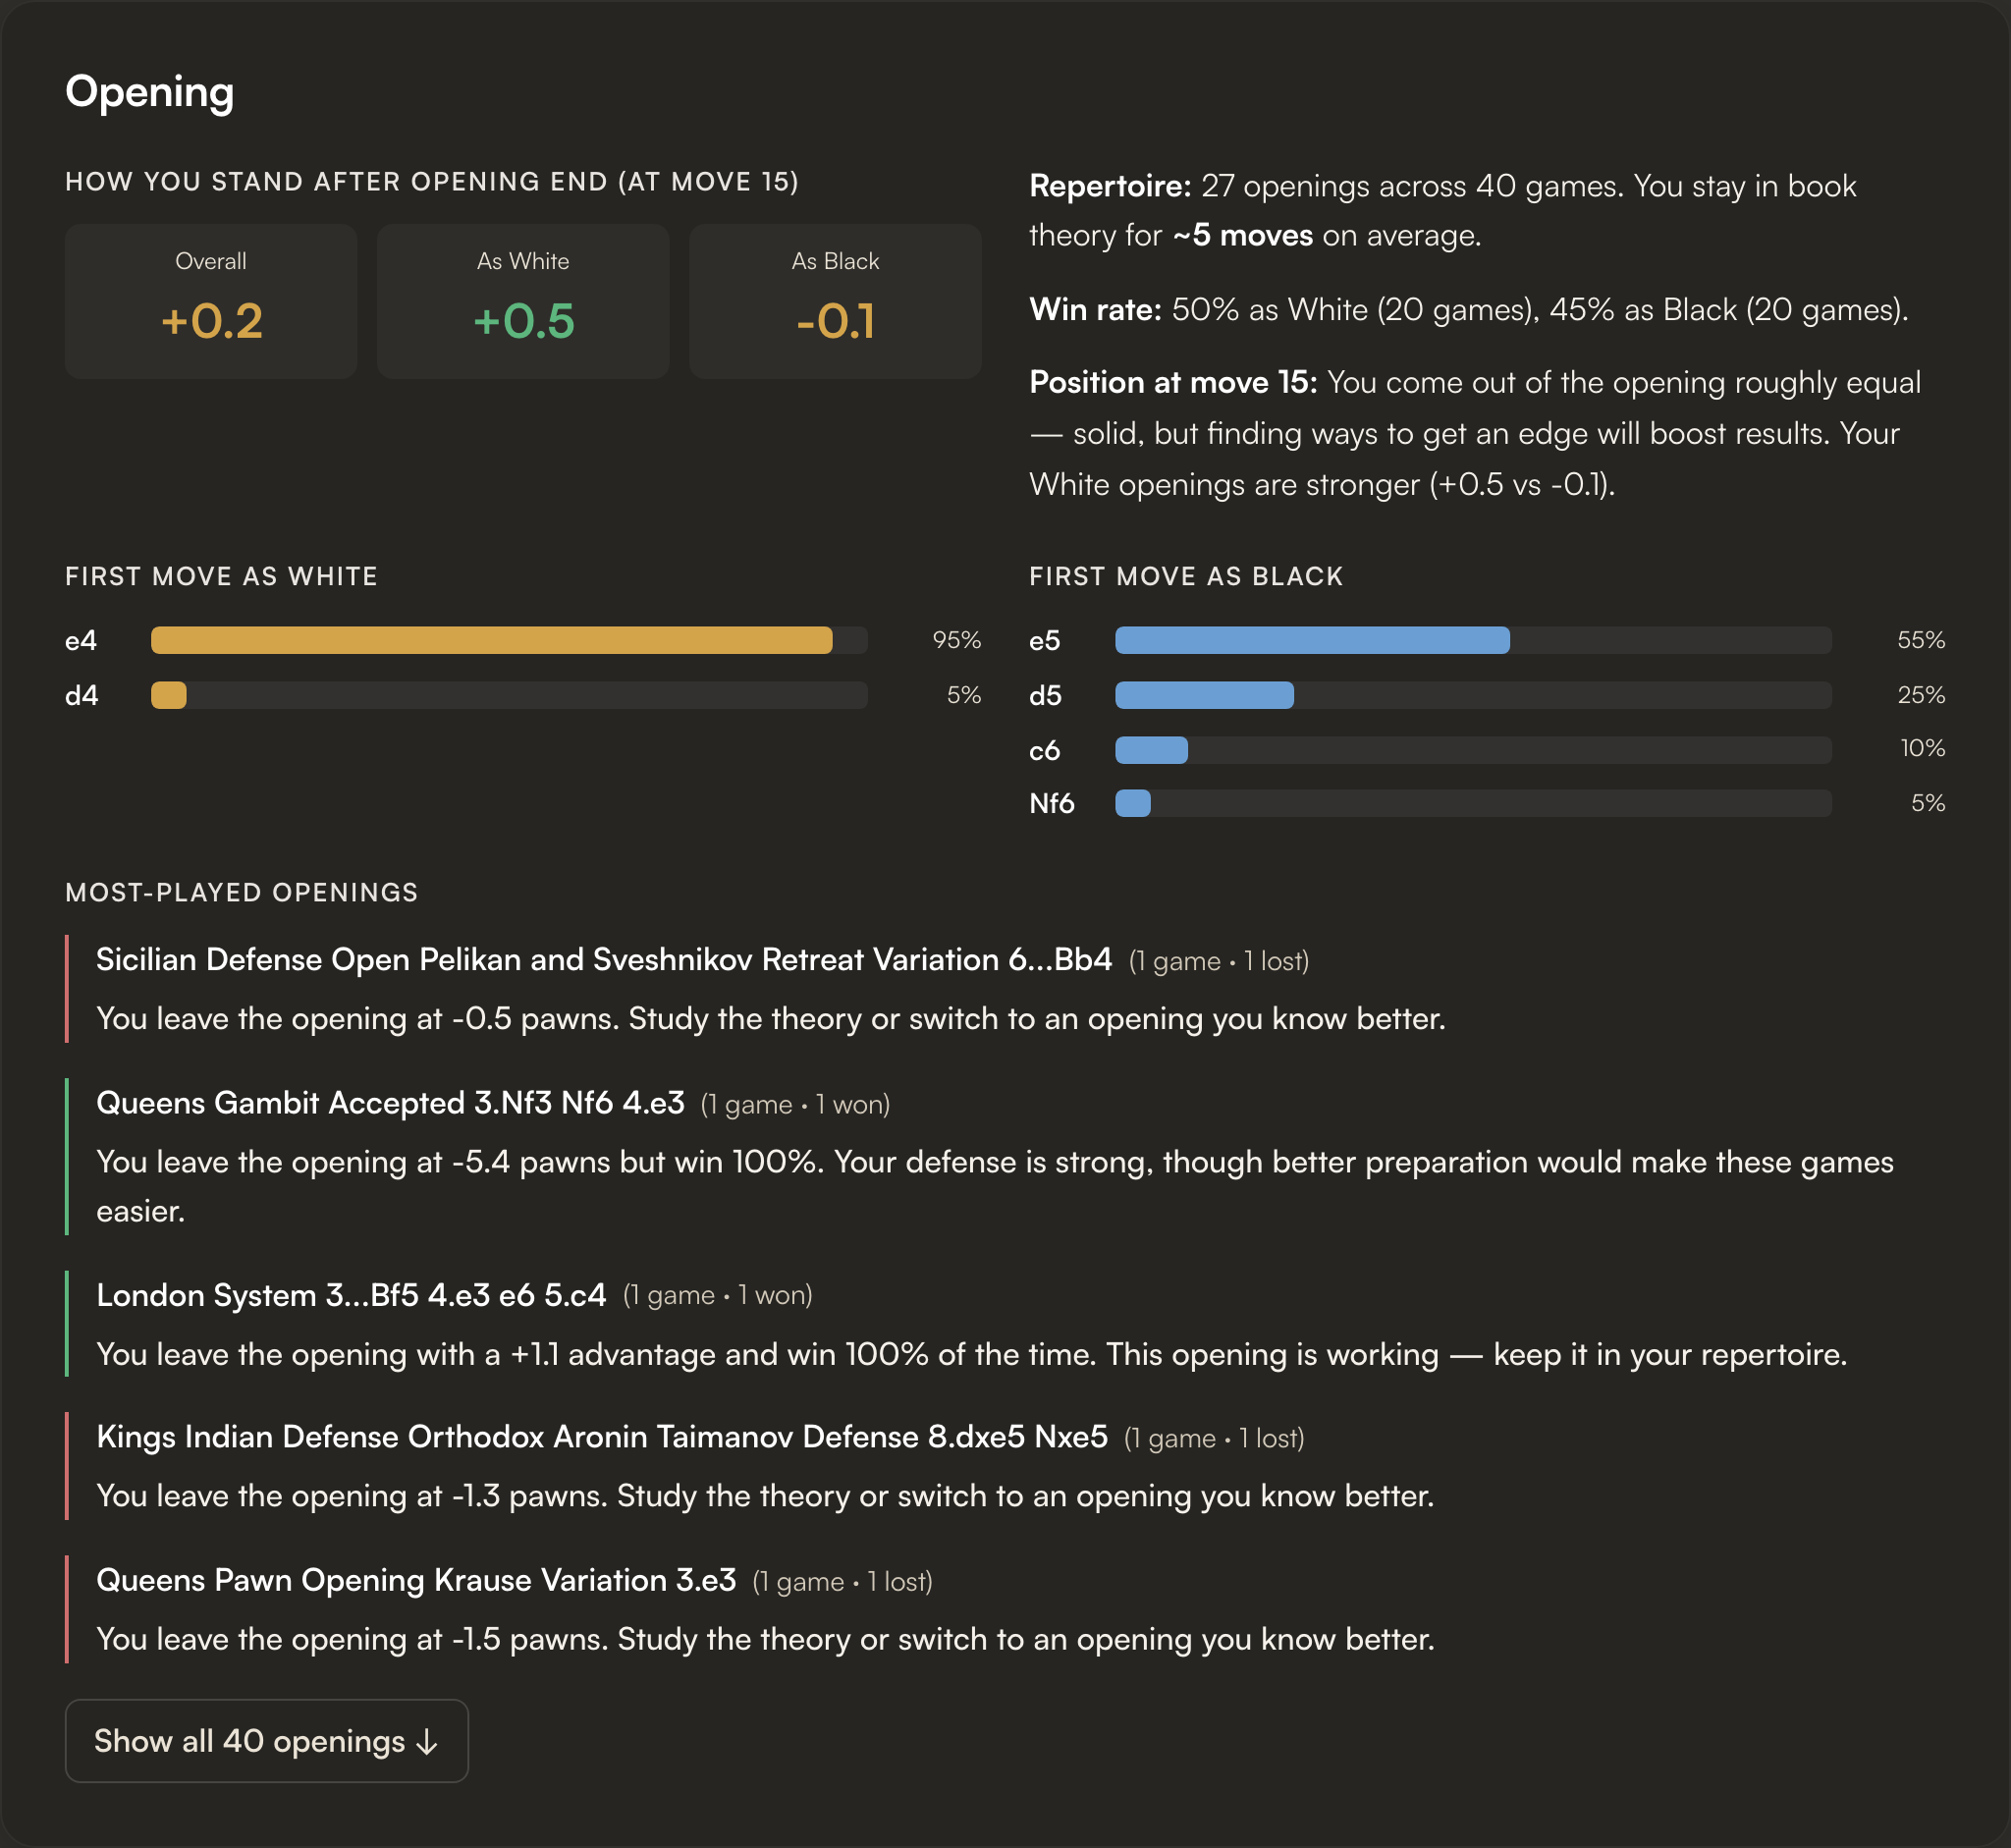
Opening
Three views of your repertoire: your most-played openings as White and as Black (with win rate, accuracy, and the move number where you leave theory), a first-move breakdown, and an expandable list of every opening you've played. The leave-book move number is the move at which your play diverges from established theory.
Tactics and move quality
A horizontal bar for every classification, percentage of moves on the bar, raw count on the right.
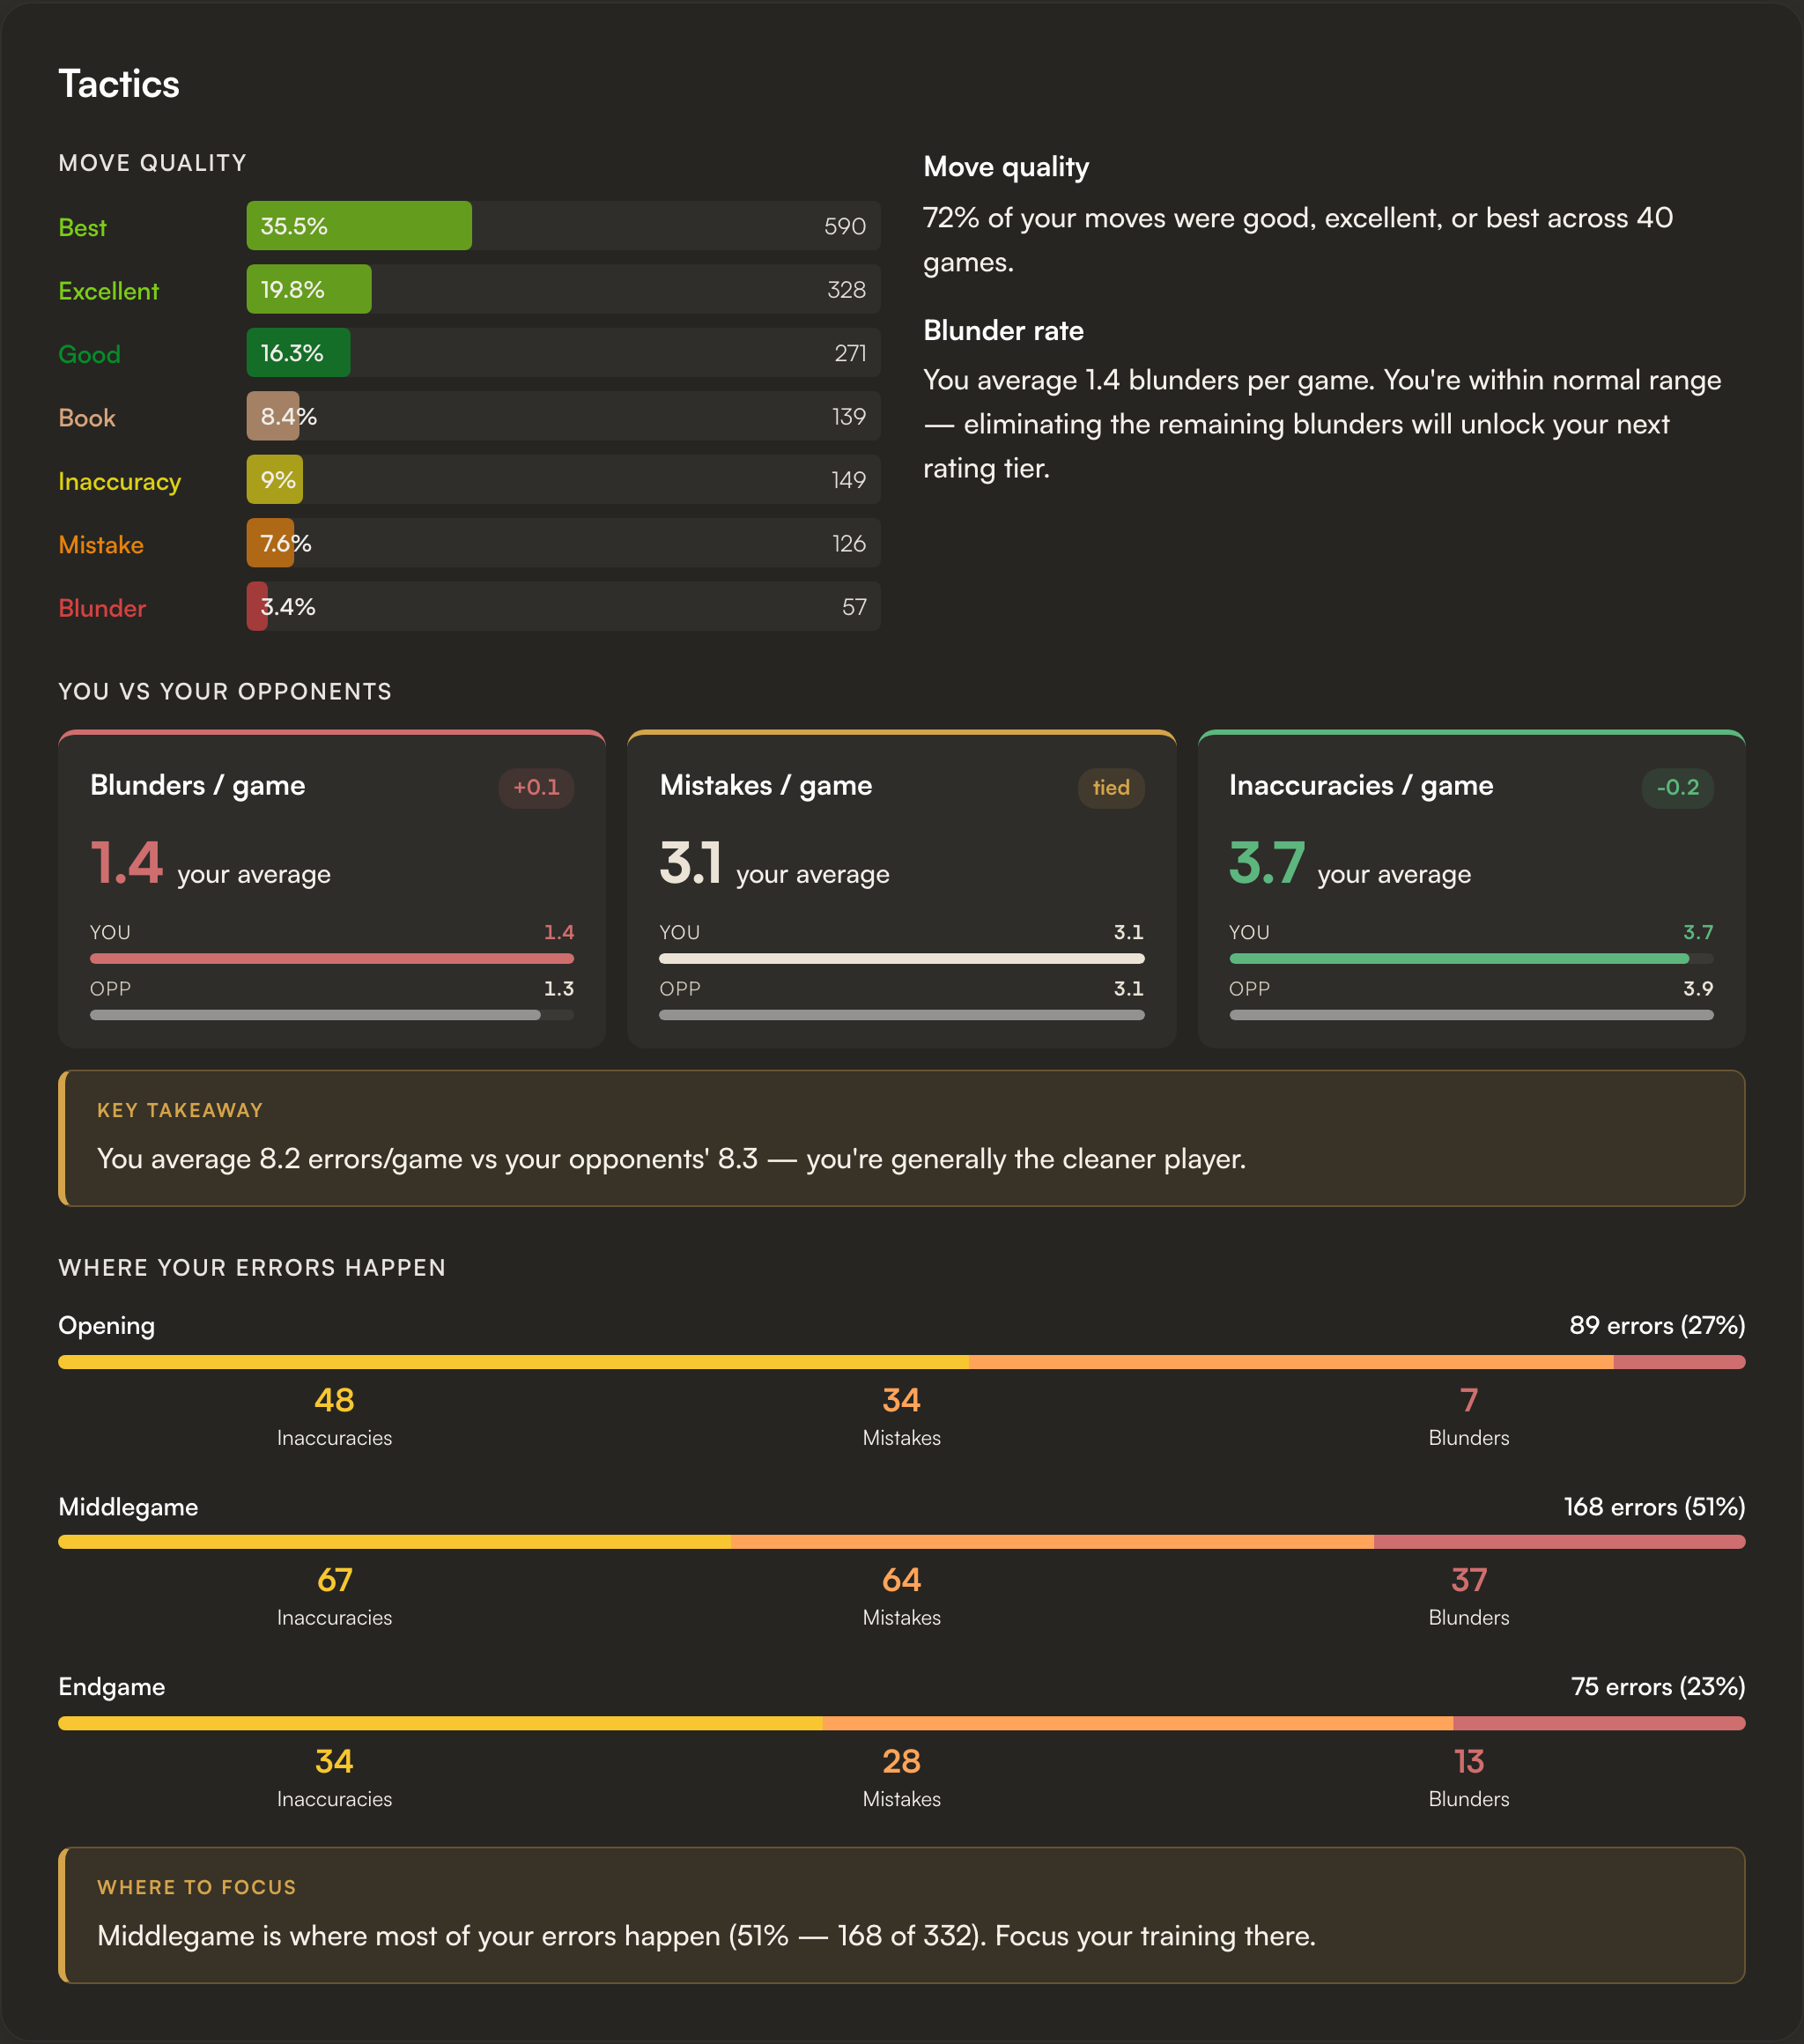
Move quality as a horizontal bar per classification, with the percentage on the bar and the raw count on the right.
You vs Your Opponents
At the bottom of the Tactics card, your blunders, mistakes, and inaccuracies per game sit alongside what your actual opponents averaged across the same set of games. If you give away more than they do, the gap is where your rating leaks.
Endgame
A bar per game showing endgame accuracy vs your overall average. Endgame by Position Type splits your endings into With Advantage, Equal, and With Disadvantage, separating "I can't convert" from "I can't defend".
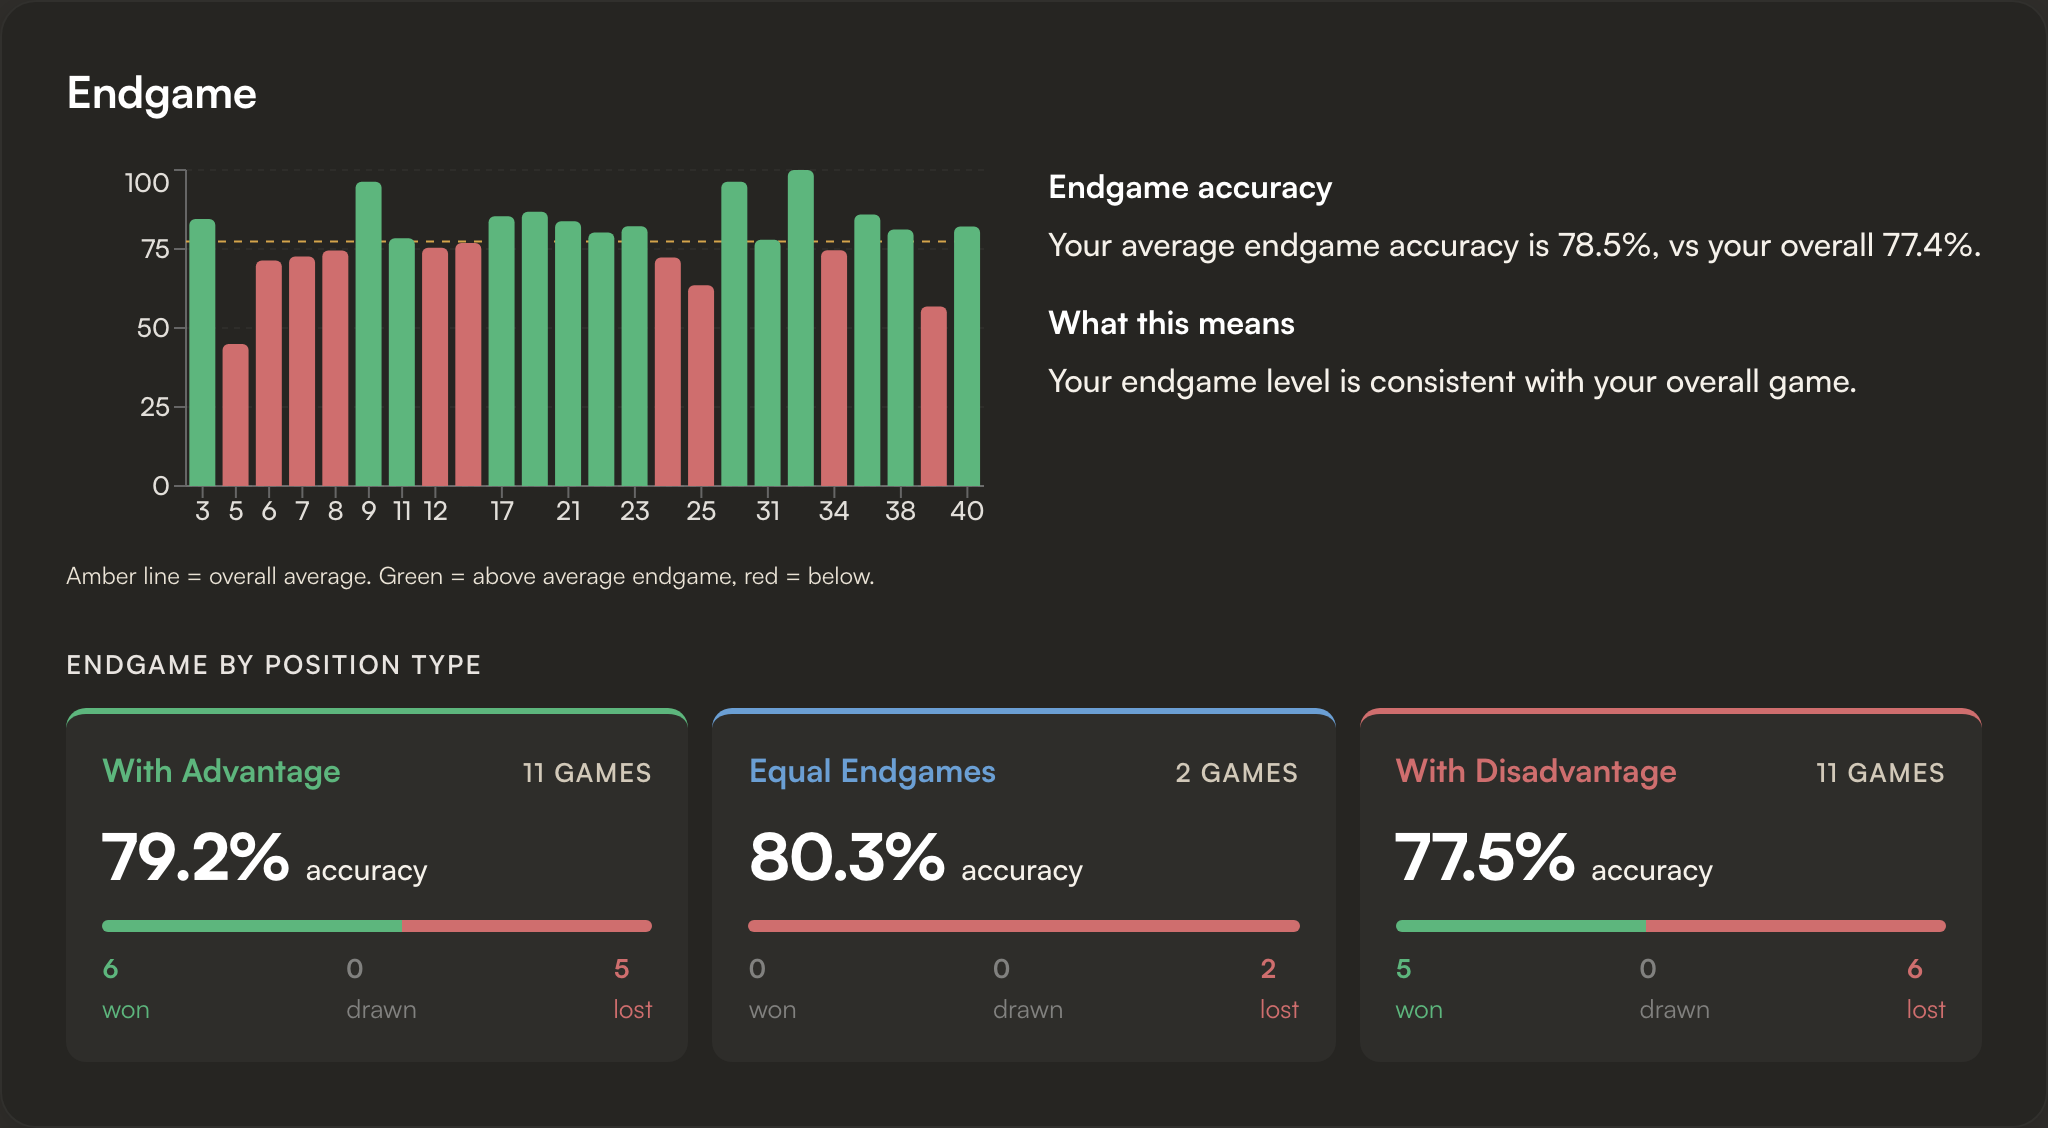
Per-game accuracy bars on top, position-type tiles below. The position-type split separates "I can't convert" from "I can't defend".
Advantage Capitalization
Of all the games where you reached a 1.5-pawn advantage, how many you actually won. Conversion by Advantage Size slices it by how big the lead was, and the pattern tells you whether the problem is technique or carelessness.
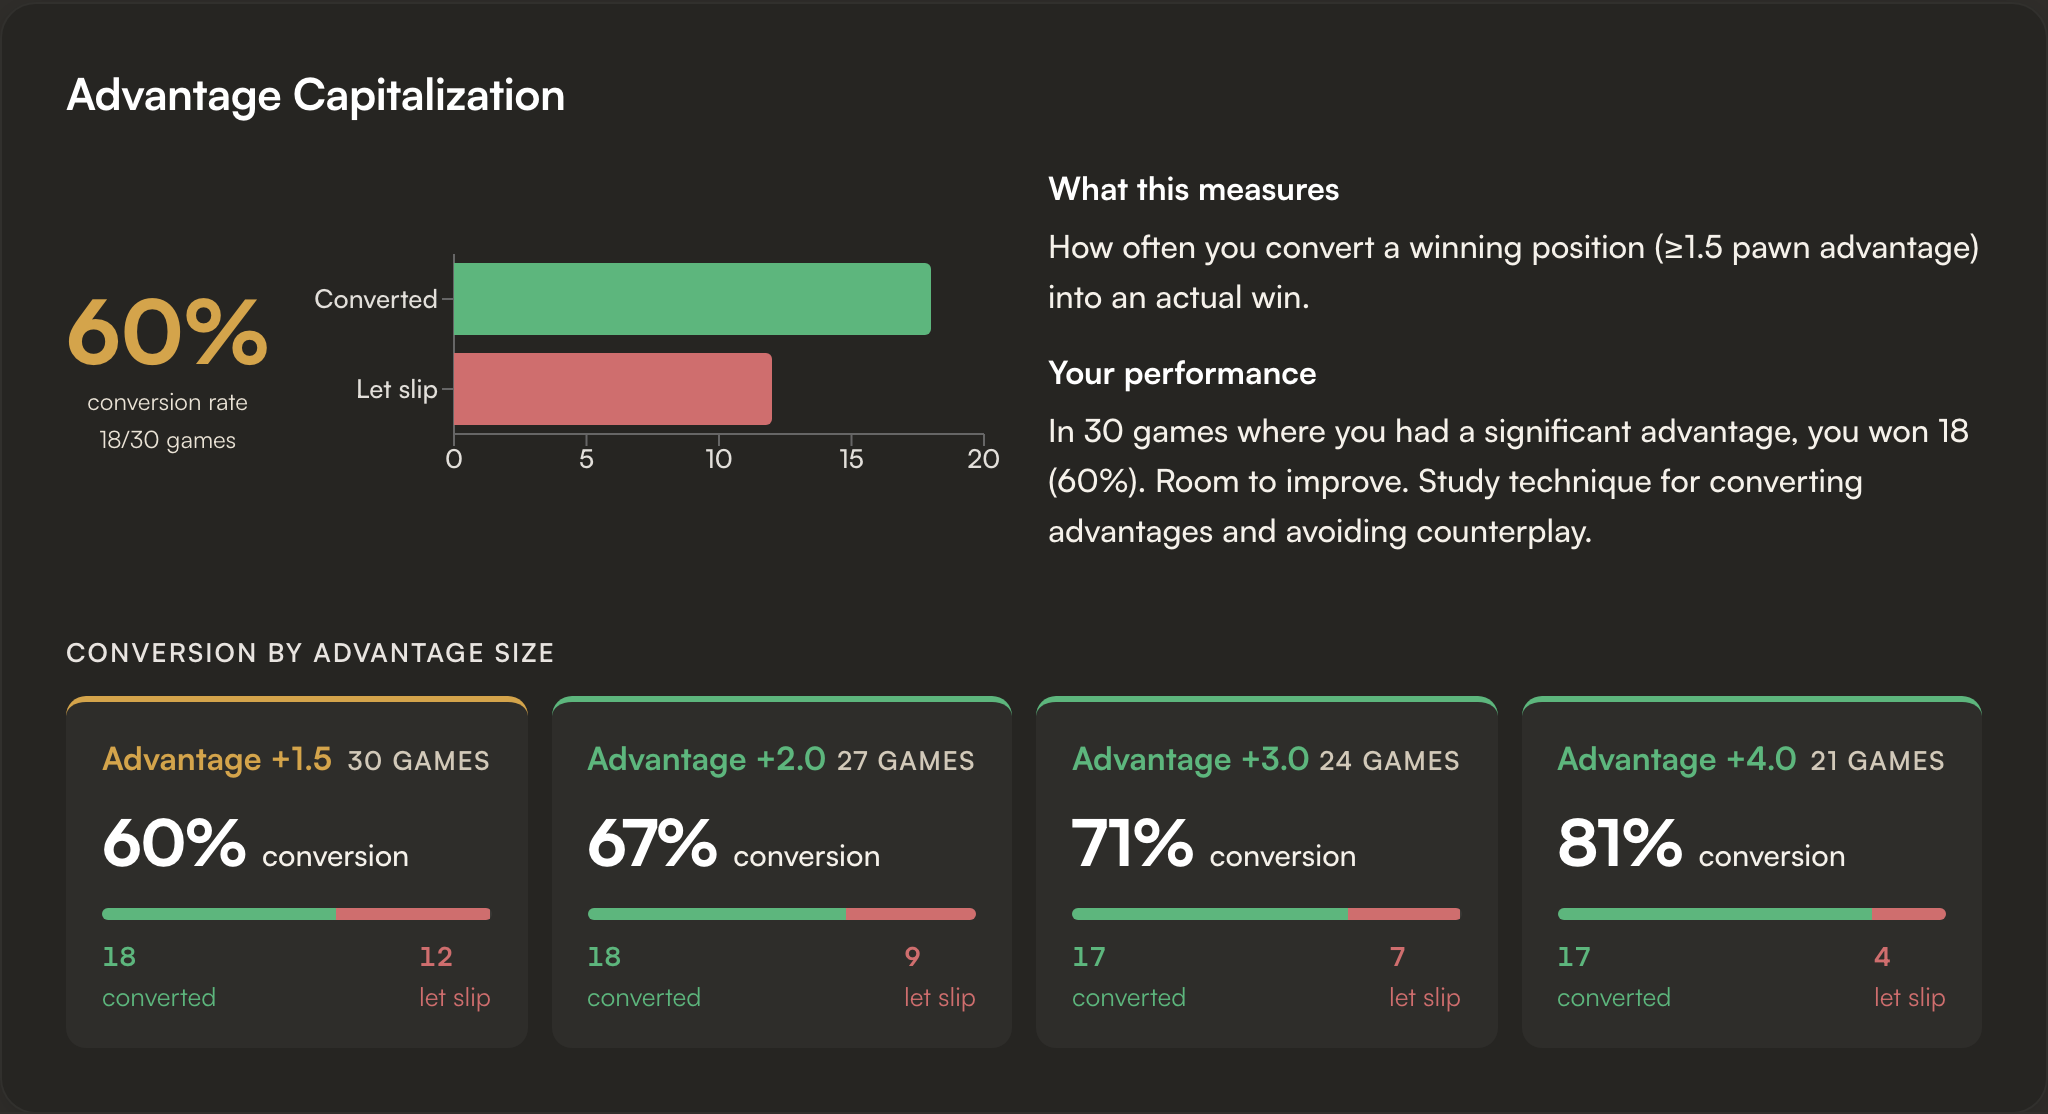
Steady climb across the buckets = technique gap on small edges. If all four were red, the problem would be carelessness instead.
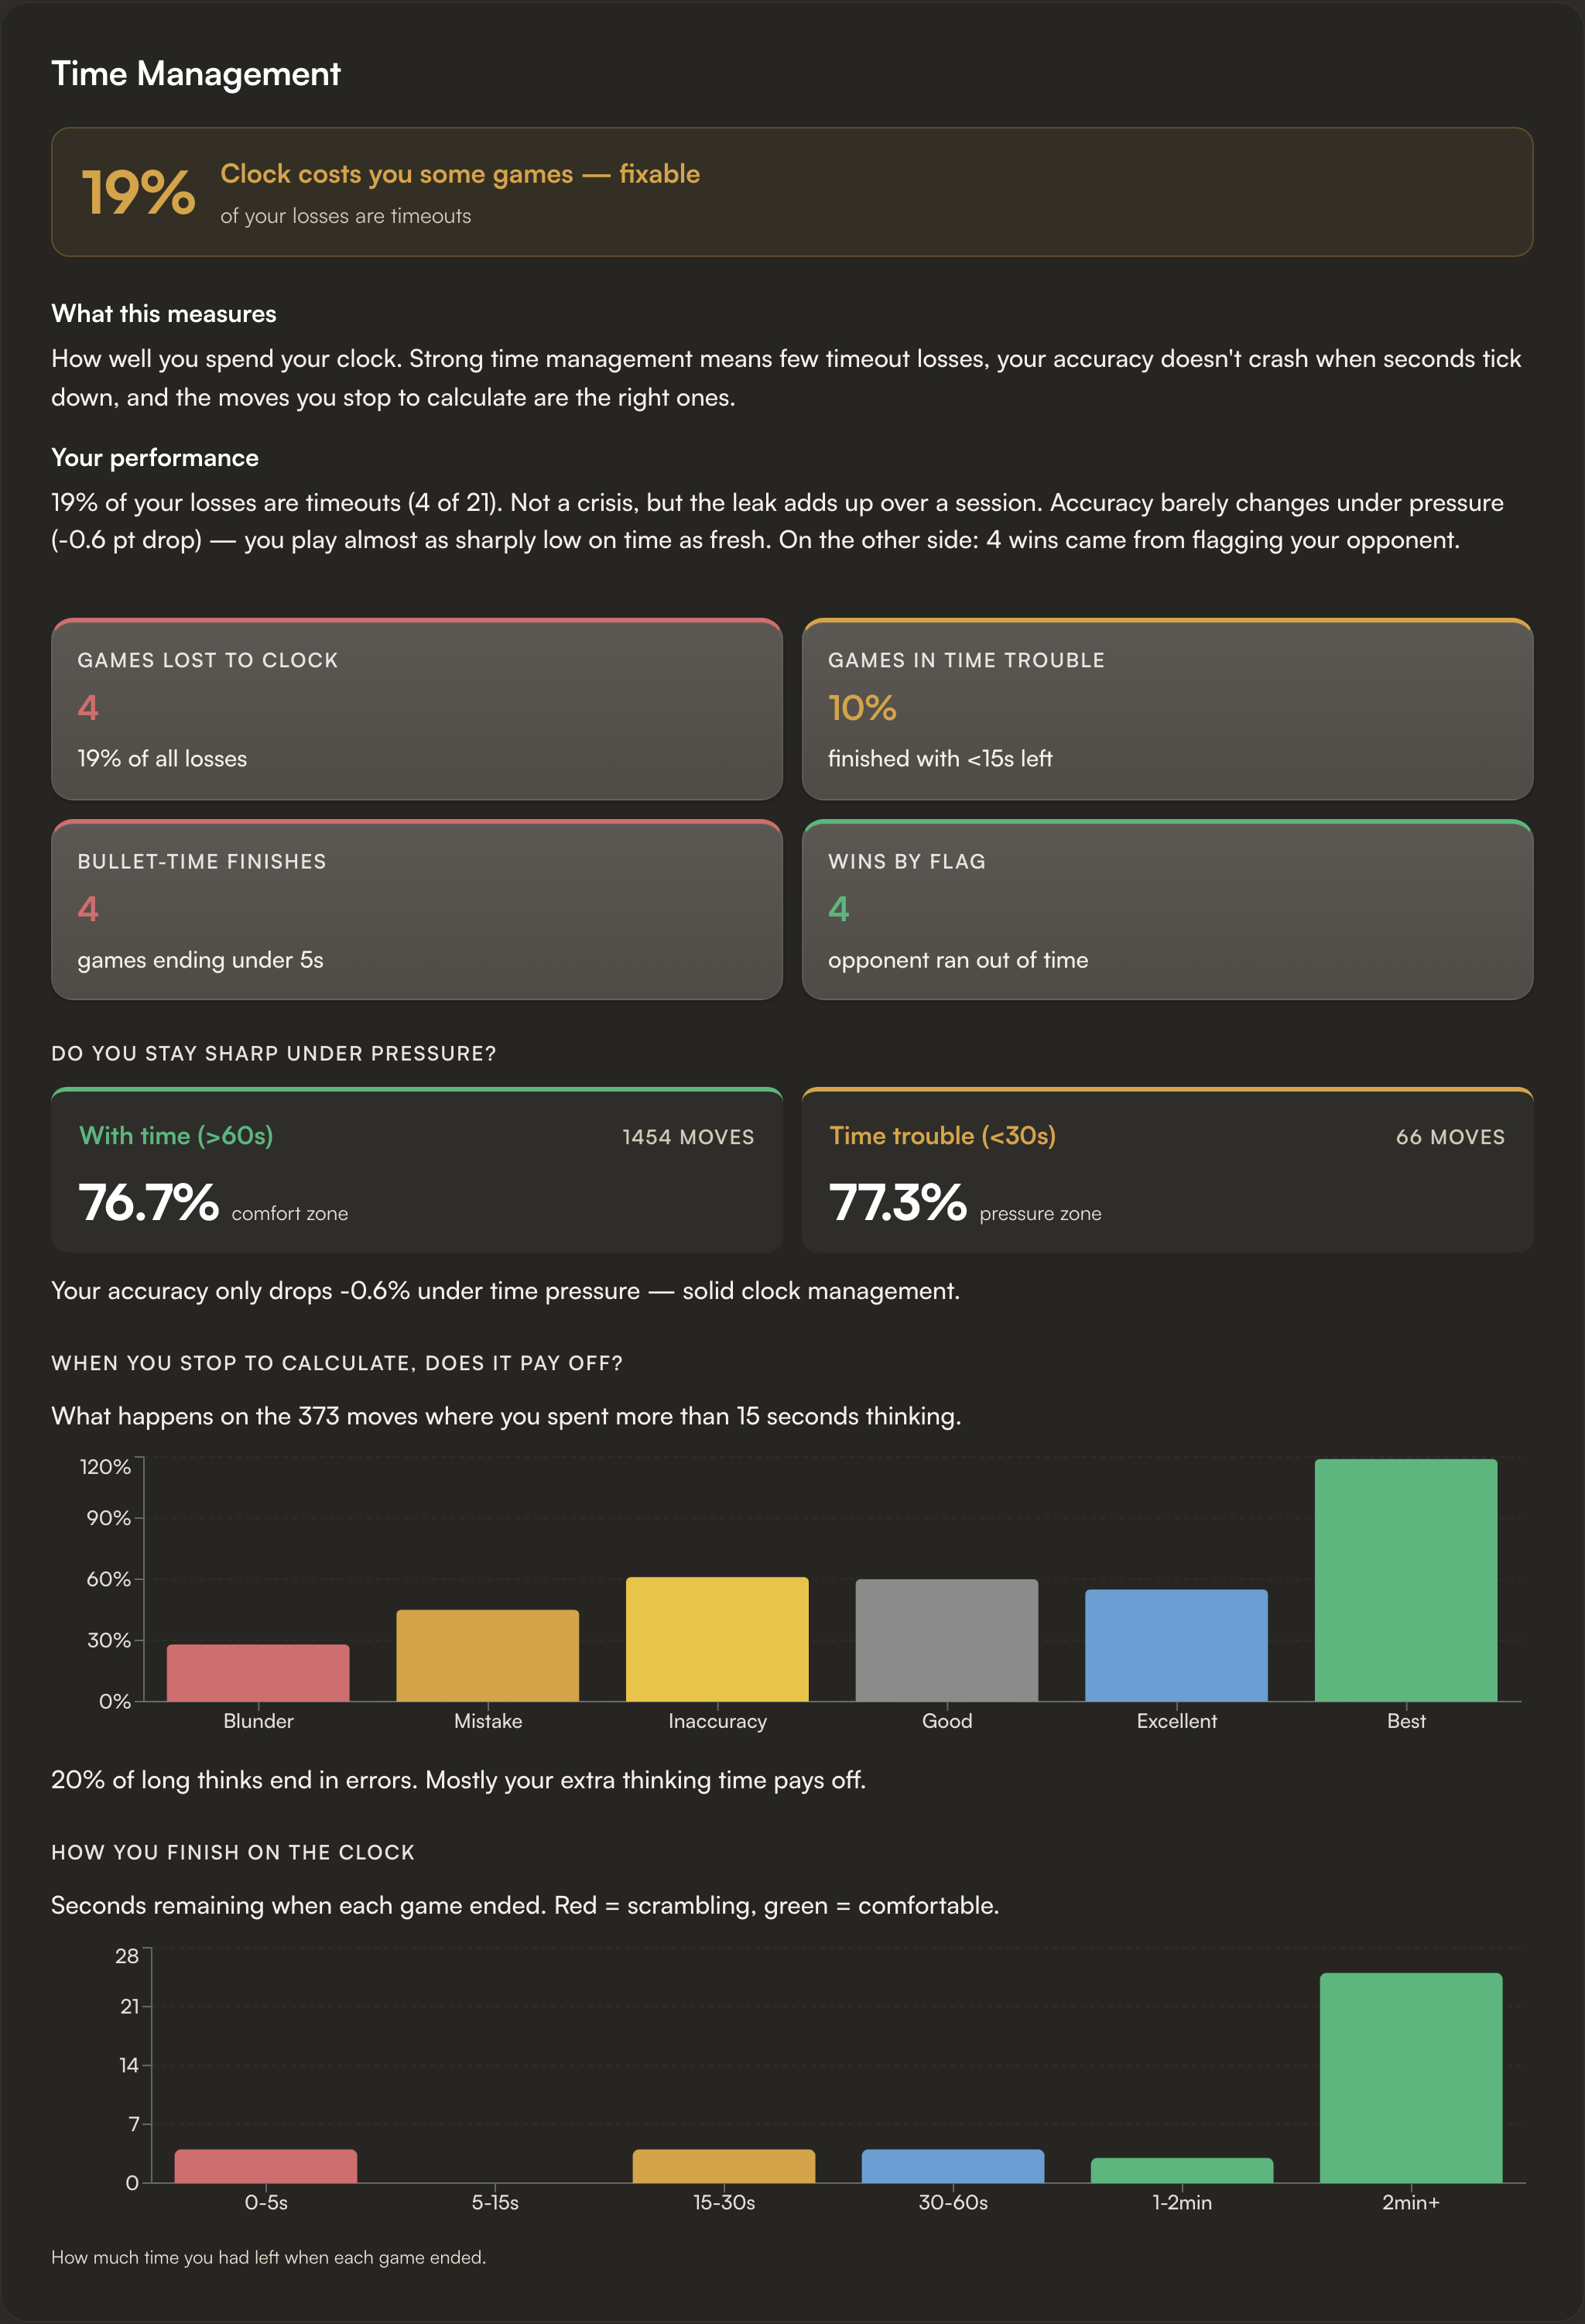
Time Management
Your time profile through the game plus clock-bucket win rates, meaning how you score when you finish with more than 2 min, 30 s to 2 min, and under 30 s on the clock. A steep drop in the lowest bucket says your tactical accuracy collapses under pressure, which is a different problem from running out of time entirely.
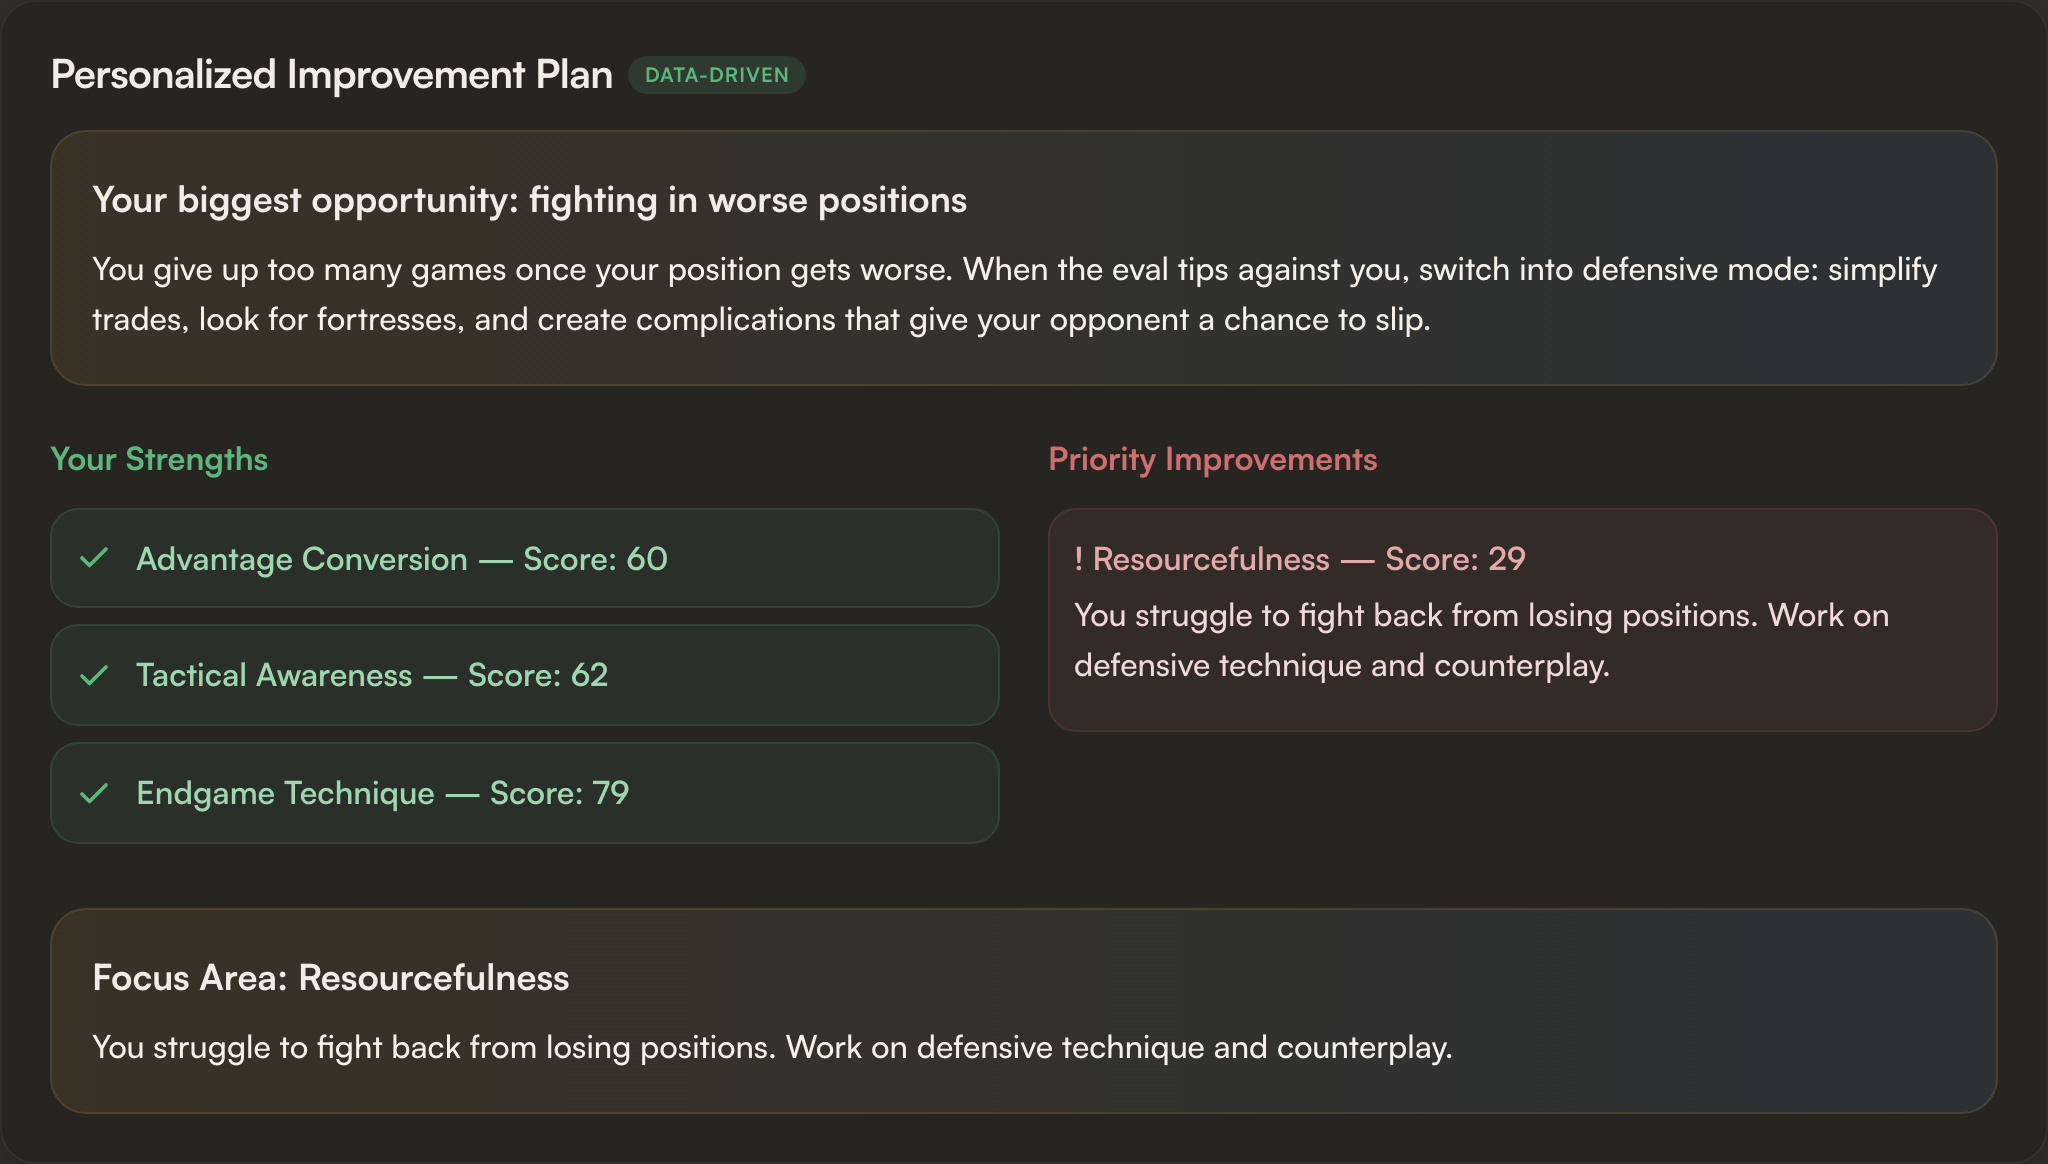
Resourcefulness
Save rate: percentage of games where you were down at least 1.5 pawns at some point and still won or drew. How Deep Did You Fall? buckets the metric by how bad it got.
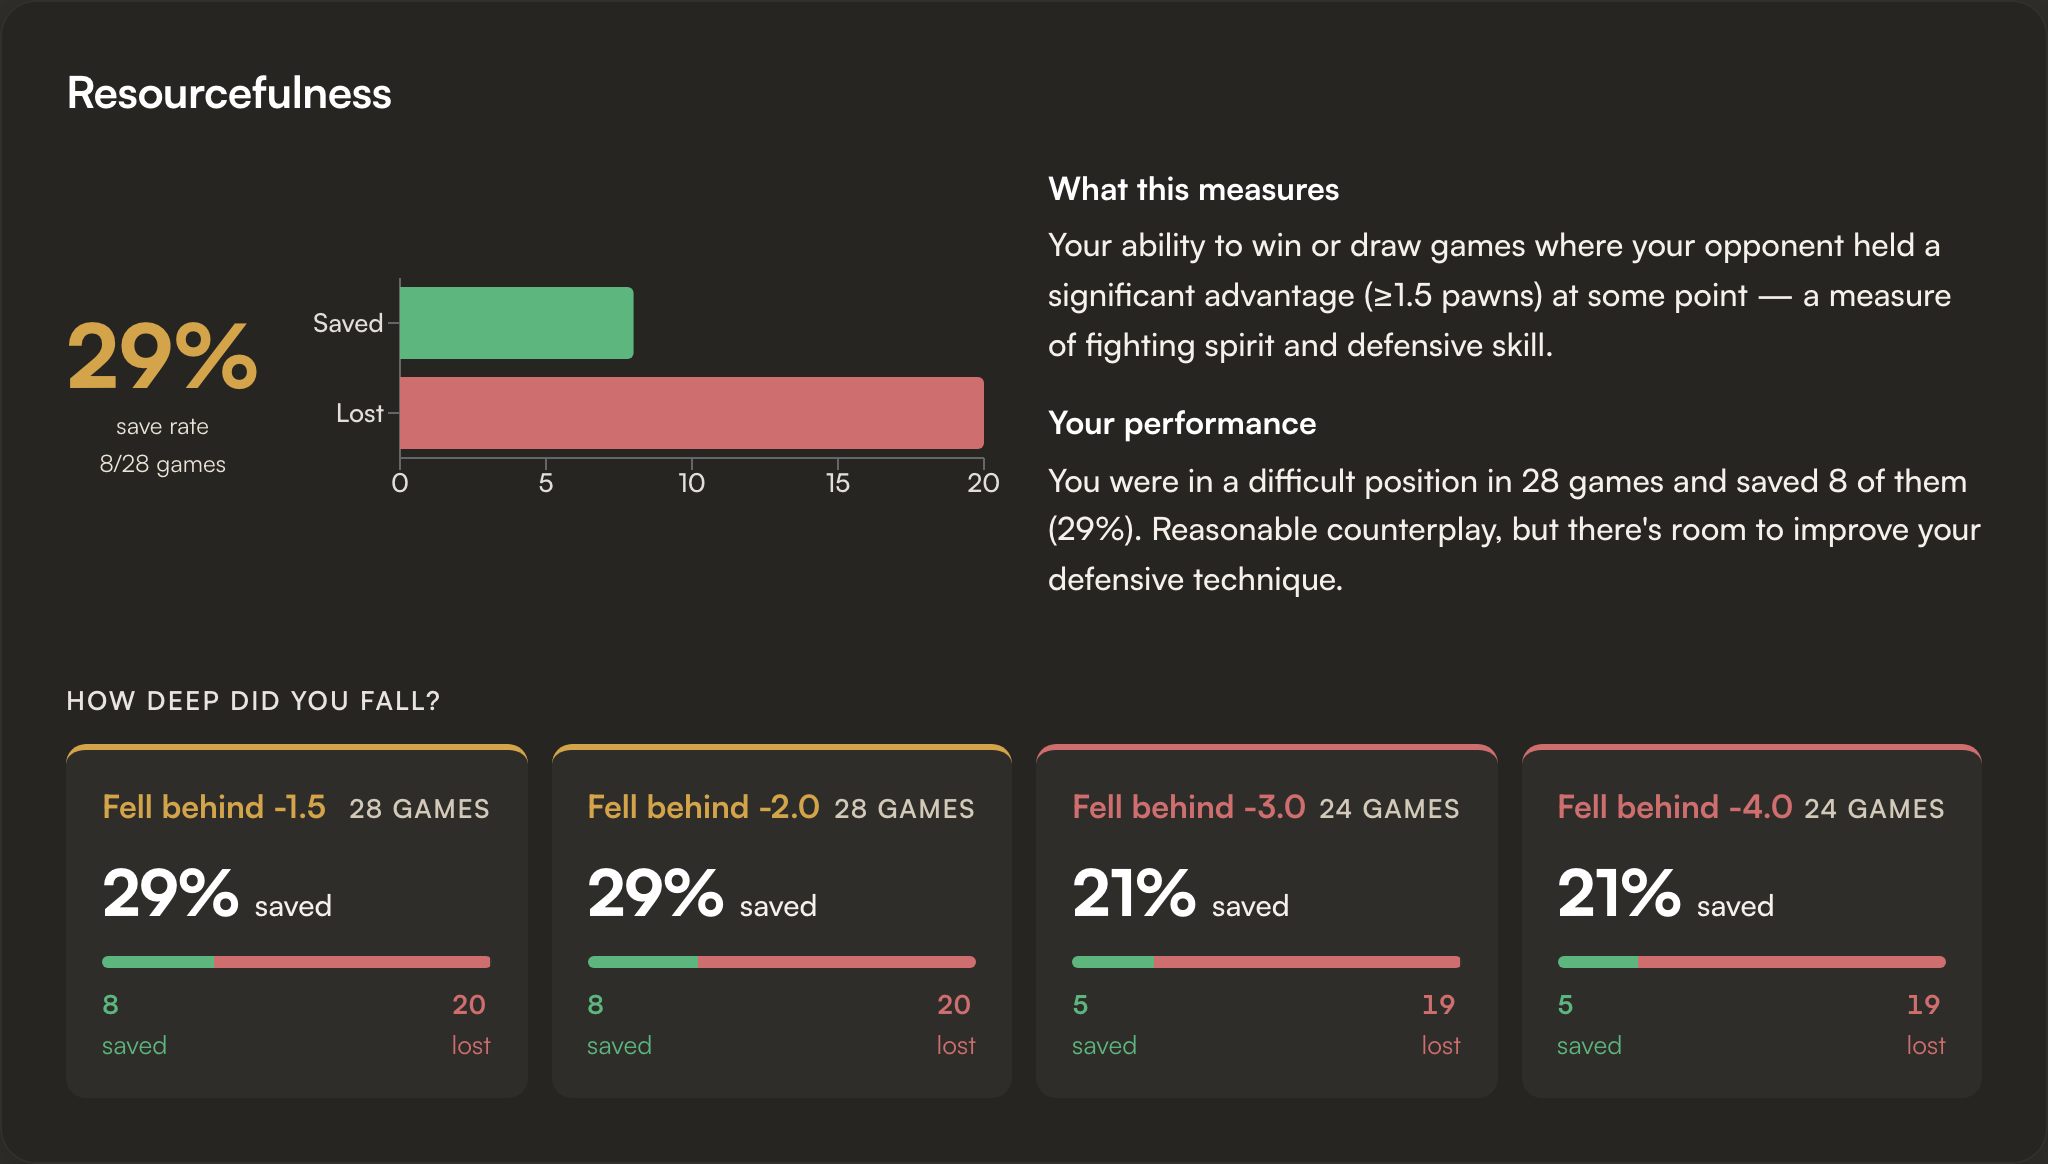
Two opposite reads possible: a fighter who claws back small deficits but folds in lost positions, or someone who plays on too long when they should resign.
Consistency
A line chart of per-game accuracy with your average overlaid. The shape matters more than any single number: a flat line above average is what you want; a saw-tooth means you tilt.
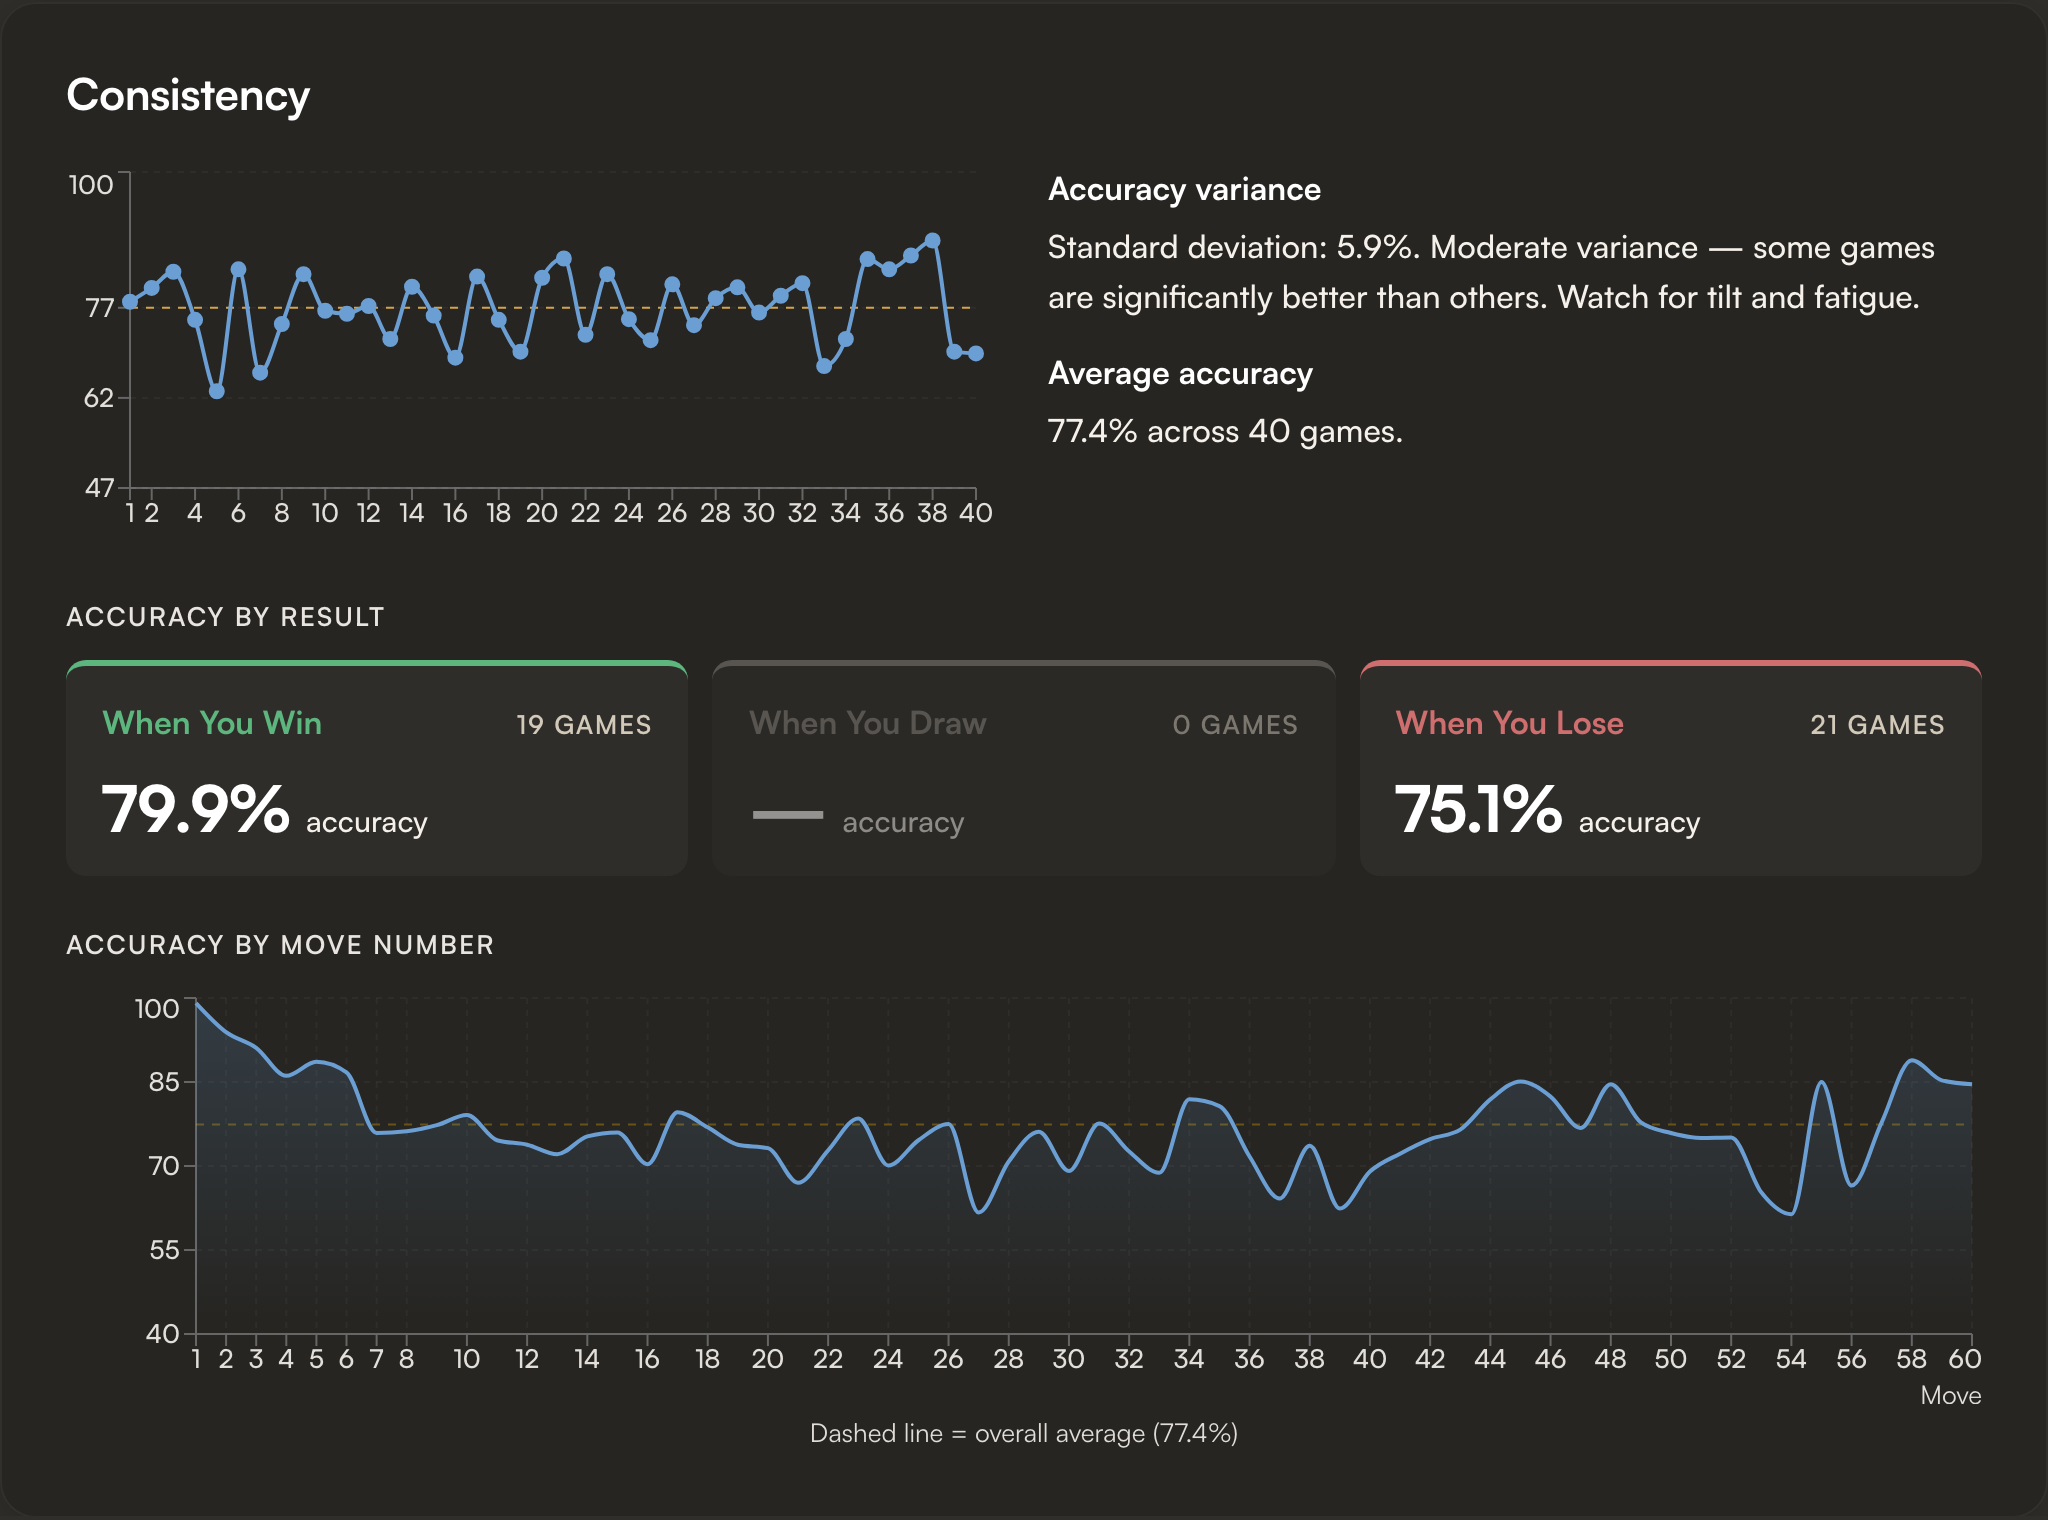
A flat line above average is what you want; a saw-tooth means you tilt.
Accuracy by Result shows your average accuracy when you win vs draw vs lose. A big gap means you only play well when you're already winning; a small gap means losses are about positions you didn't understand, not effort.
Personalized Improvement Plan
Three to five concrete next steps generated from everything above. Each is one action with a button that takes you to the training for it.
Each card names the weak dimension, the specific pattern, and a button that takes you to the training for it.
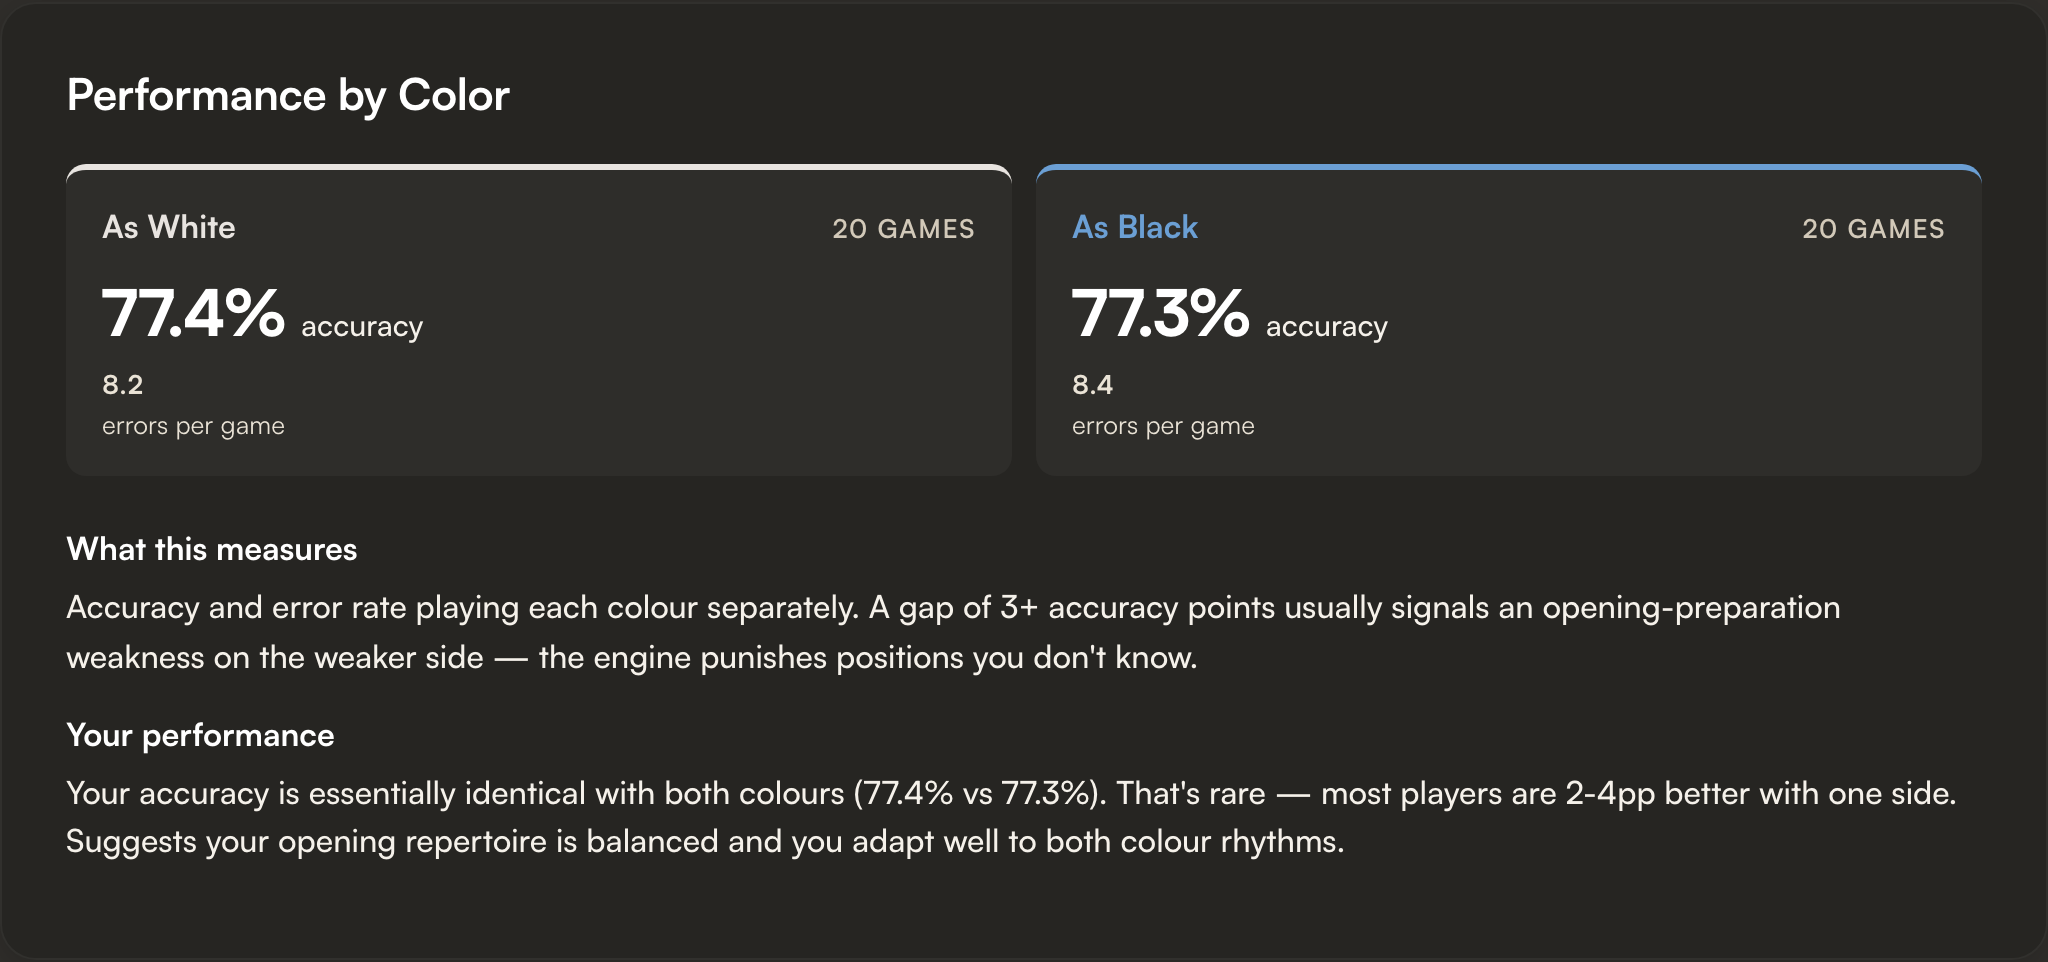
Performance by Color
Two cards side by side. A clear accuracy gap between your White and Black games usually points to a preparation hole on the weaker side.
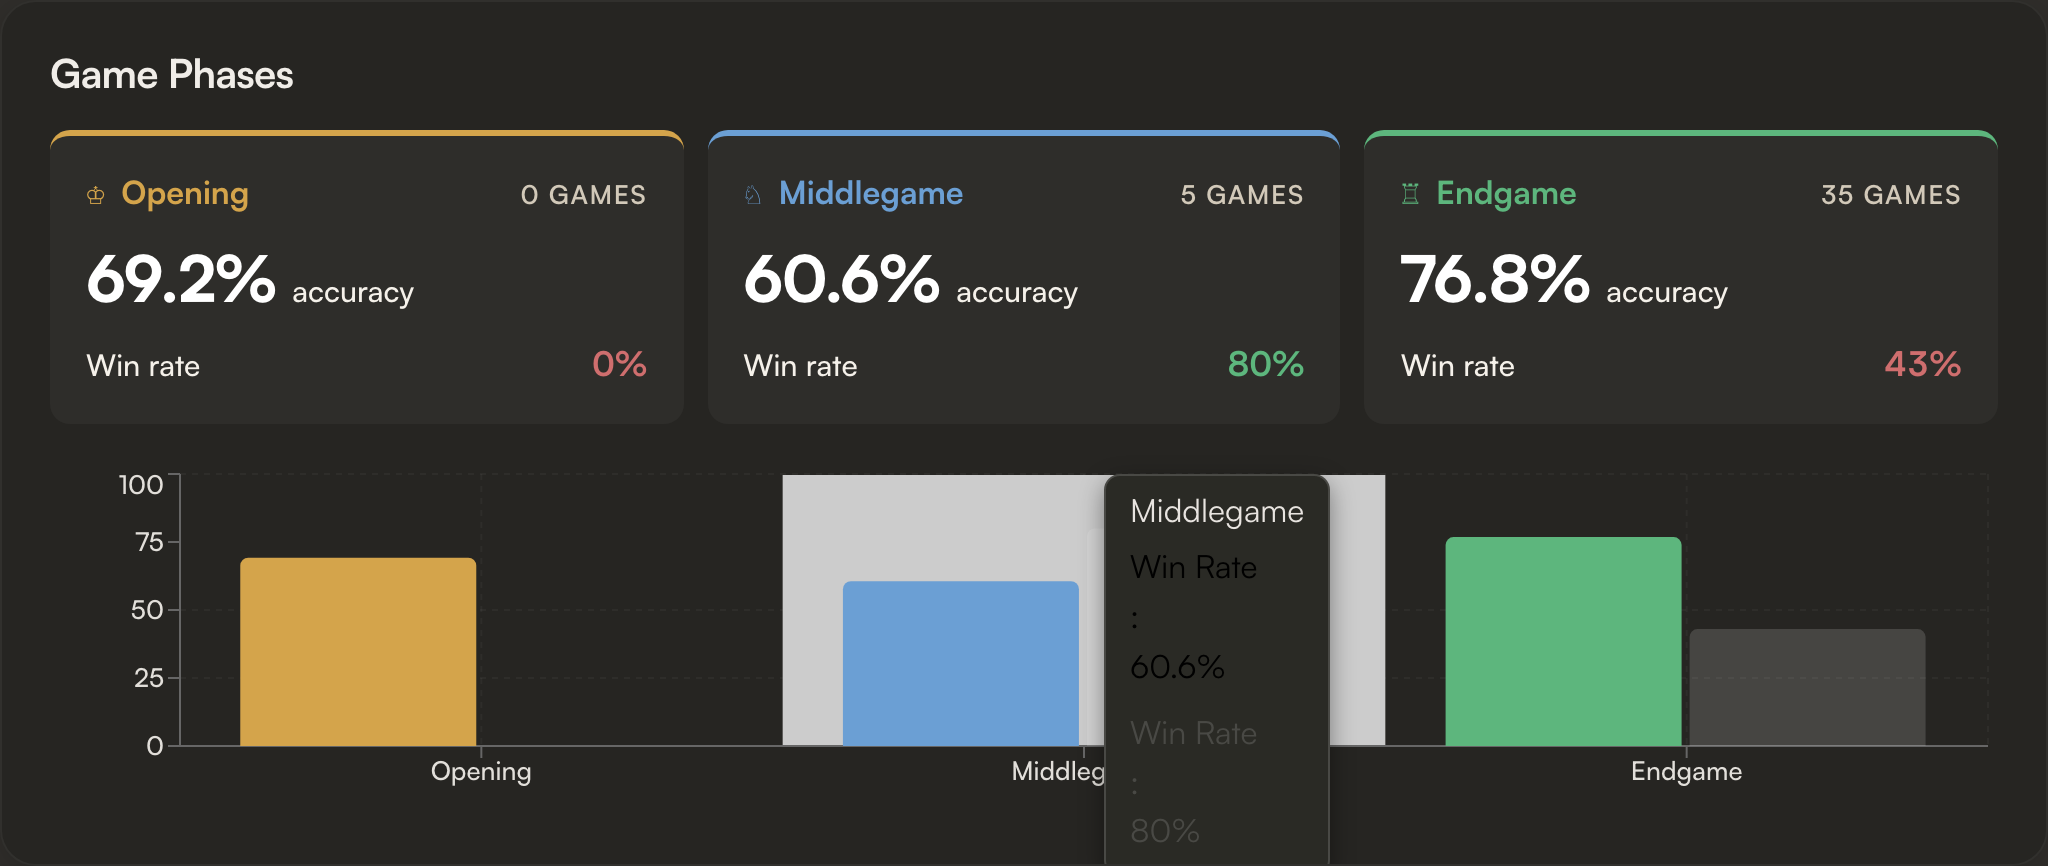
Game Phases
Three tiles for Opening, Middlegame, and Endgame, each with accuracy and win rate.
How You Win & How You Lose
Two donut charts splitting your wins and your losses by outcome: resignation, checkmate, and timeout.
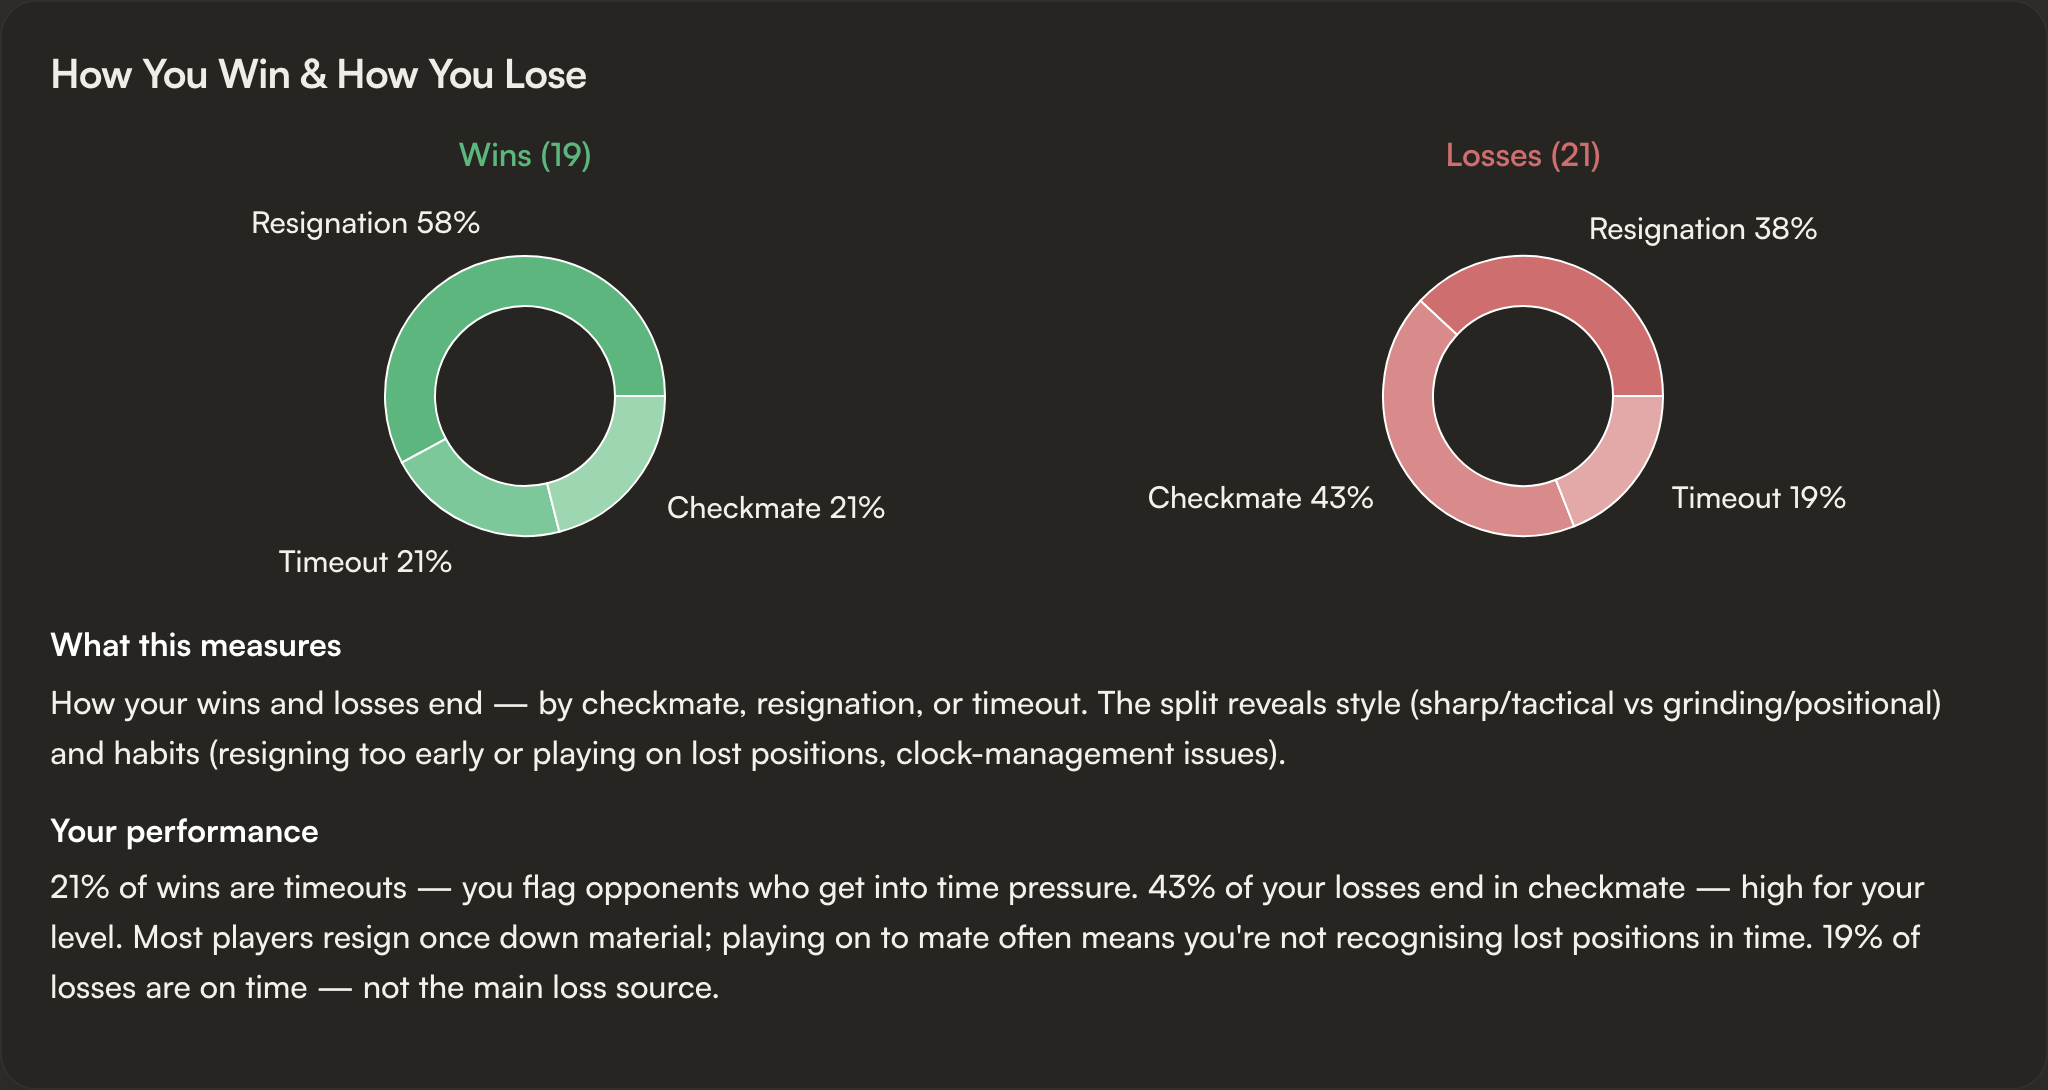
Mostly-resign wins = you're a grinder. Mostly-mate losses = you're getting tactically caught. Timeout-heavy losses = clock management.
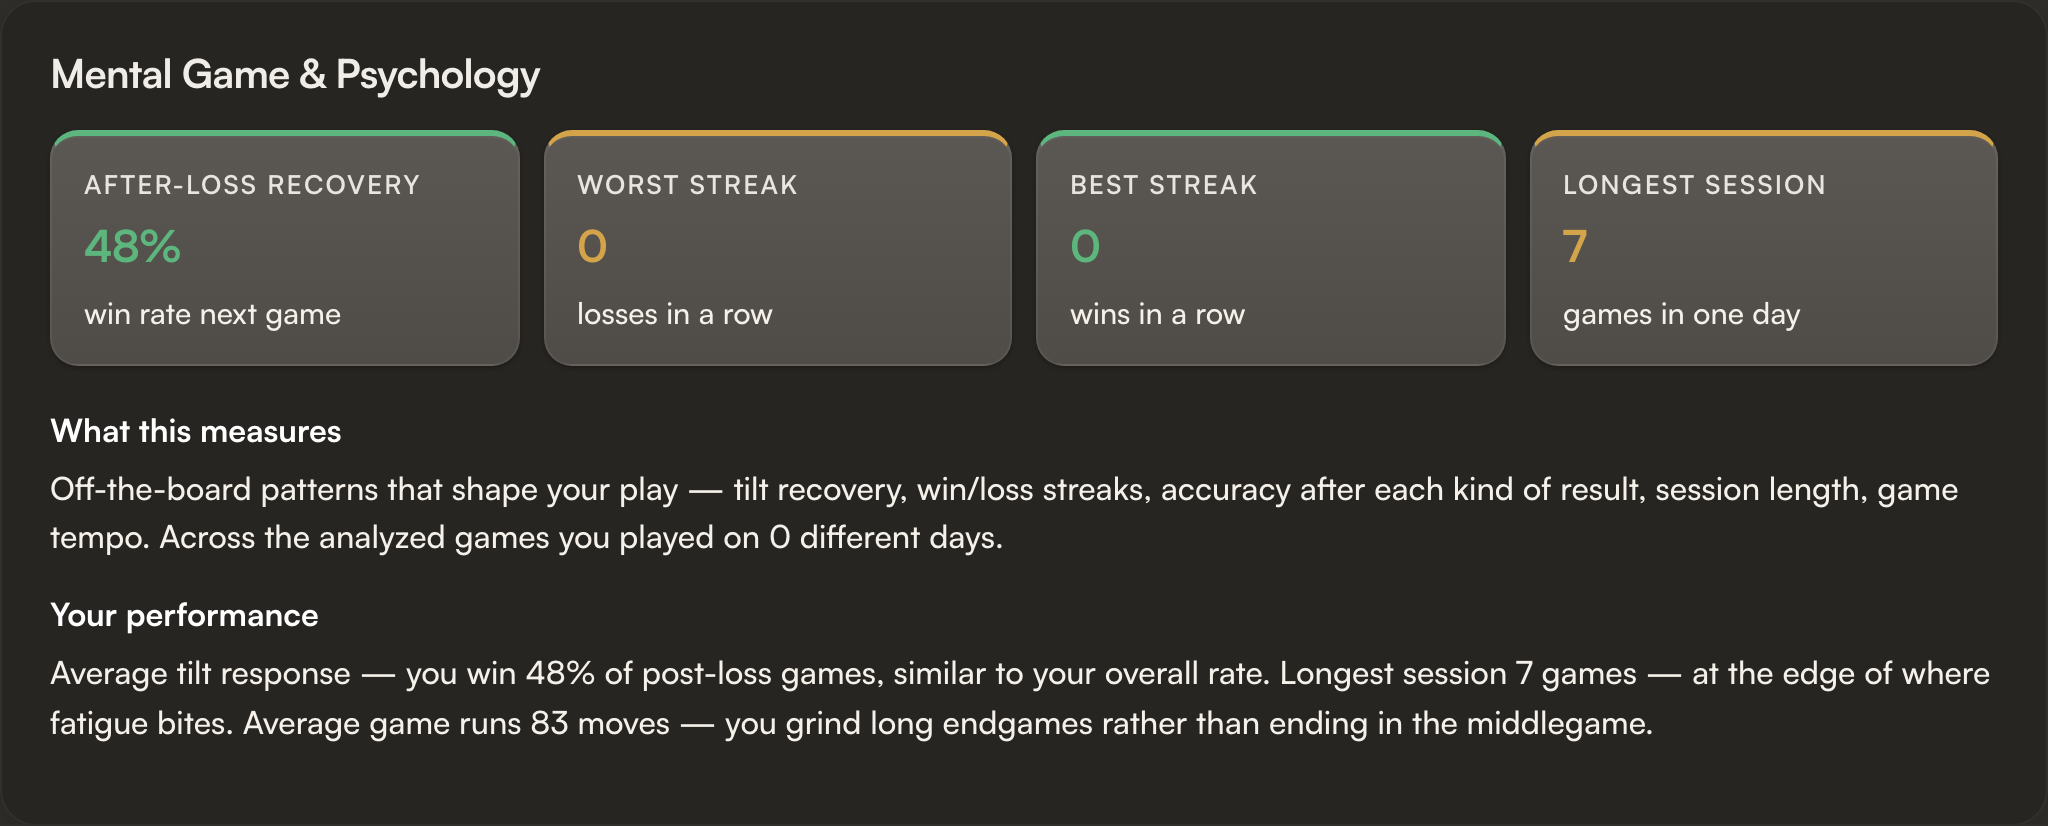
Mental Game & Psychology
A tilt indicator (your win rate in the games right after a loss, so you can see whether losing rattles you) and a resignation profile (do you resign too early, or play on in dead positions?).
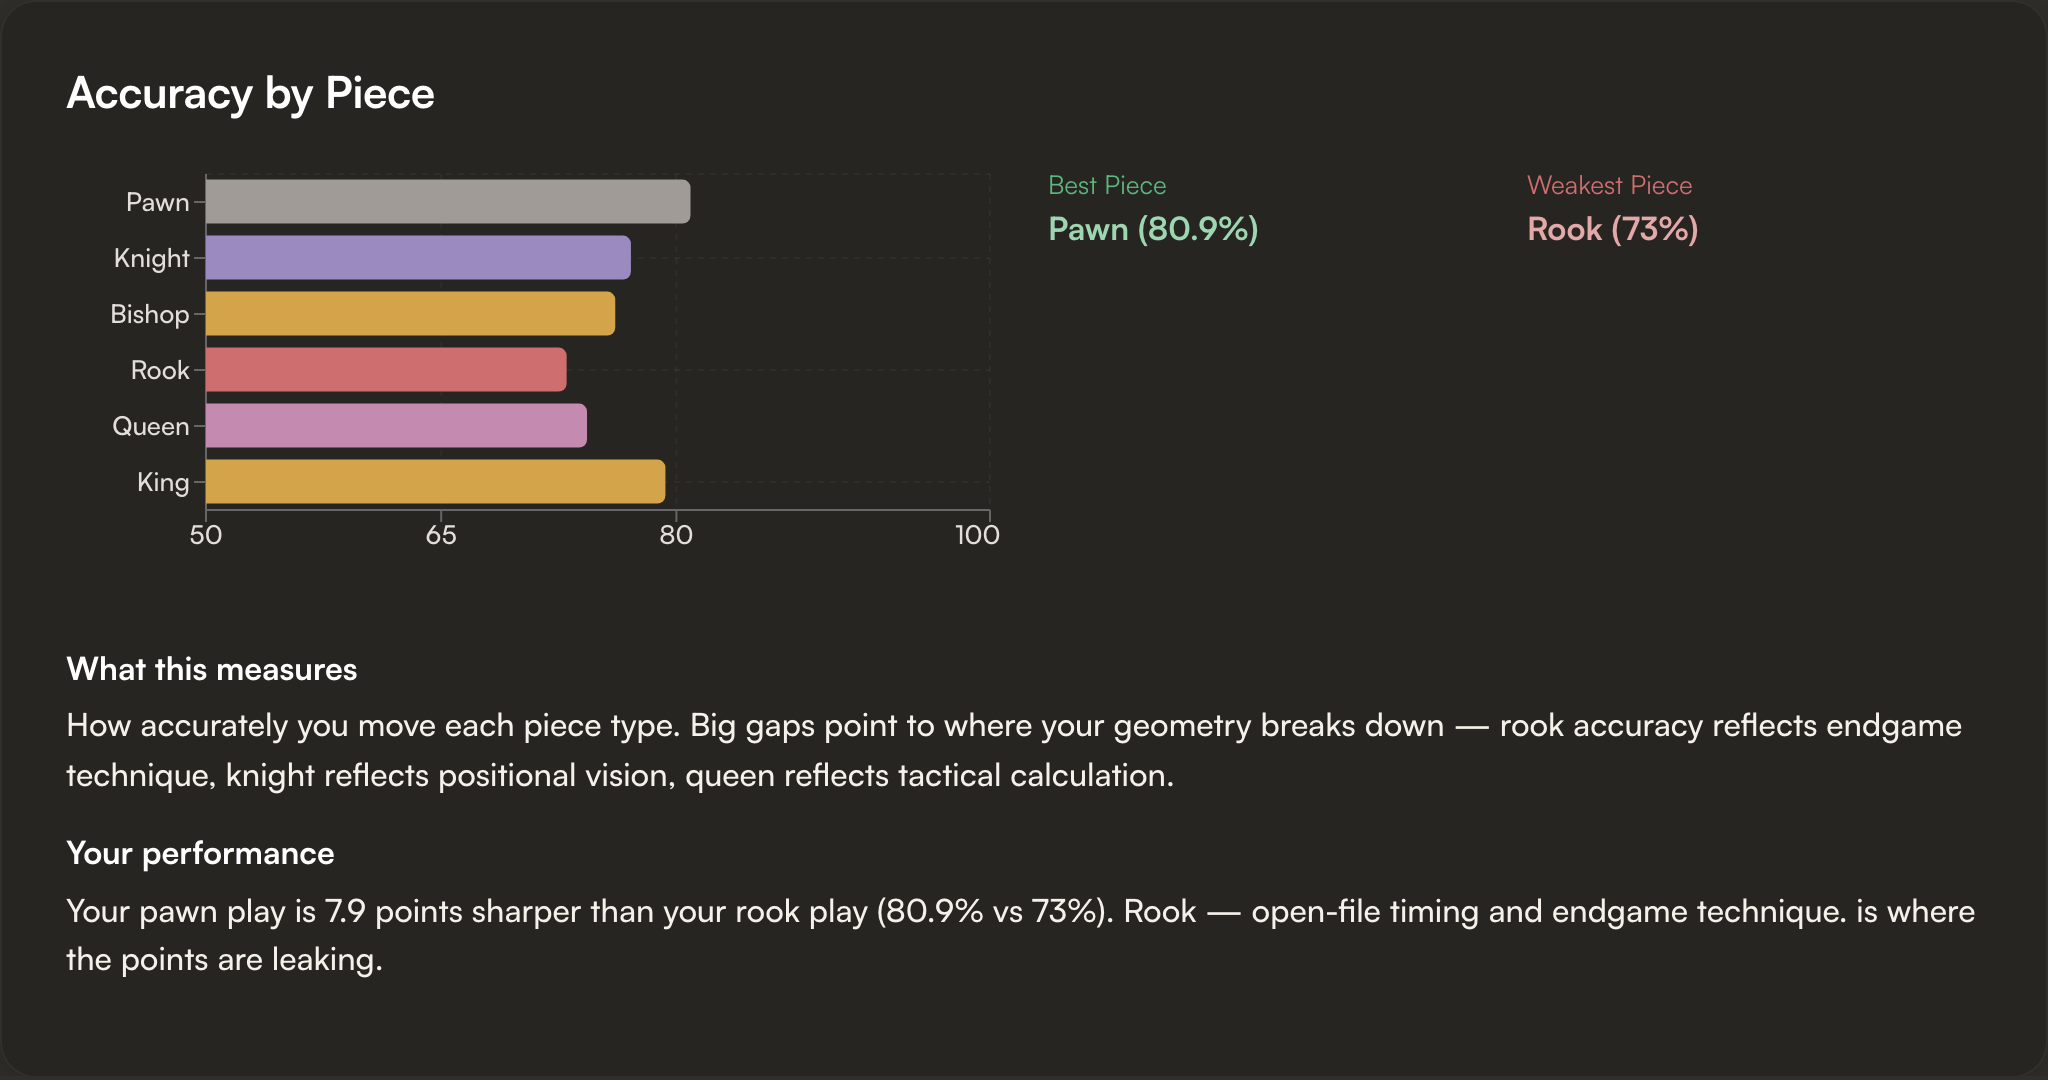
Accuracy by Piece
Your accuracy per piece type. Knight reflects positional vision; rook reflects endgame technique; queen reflects calculation.
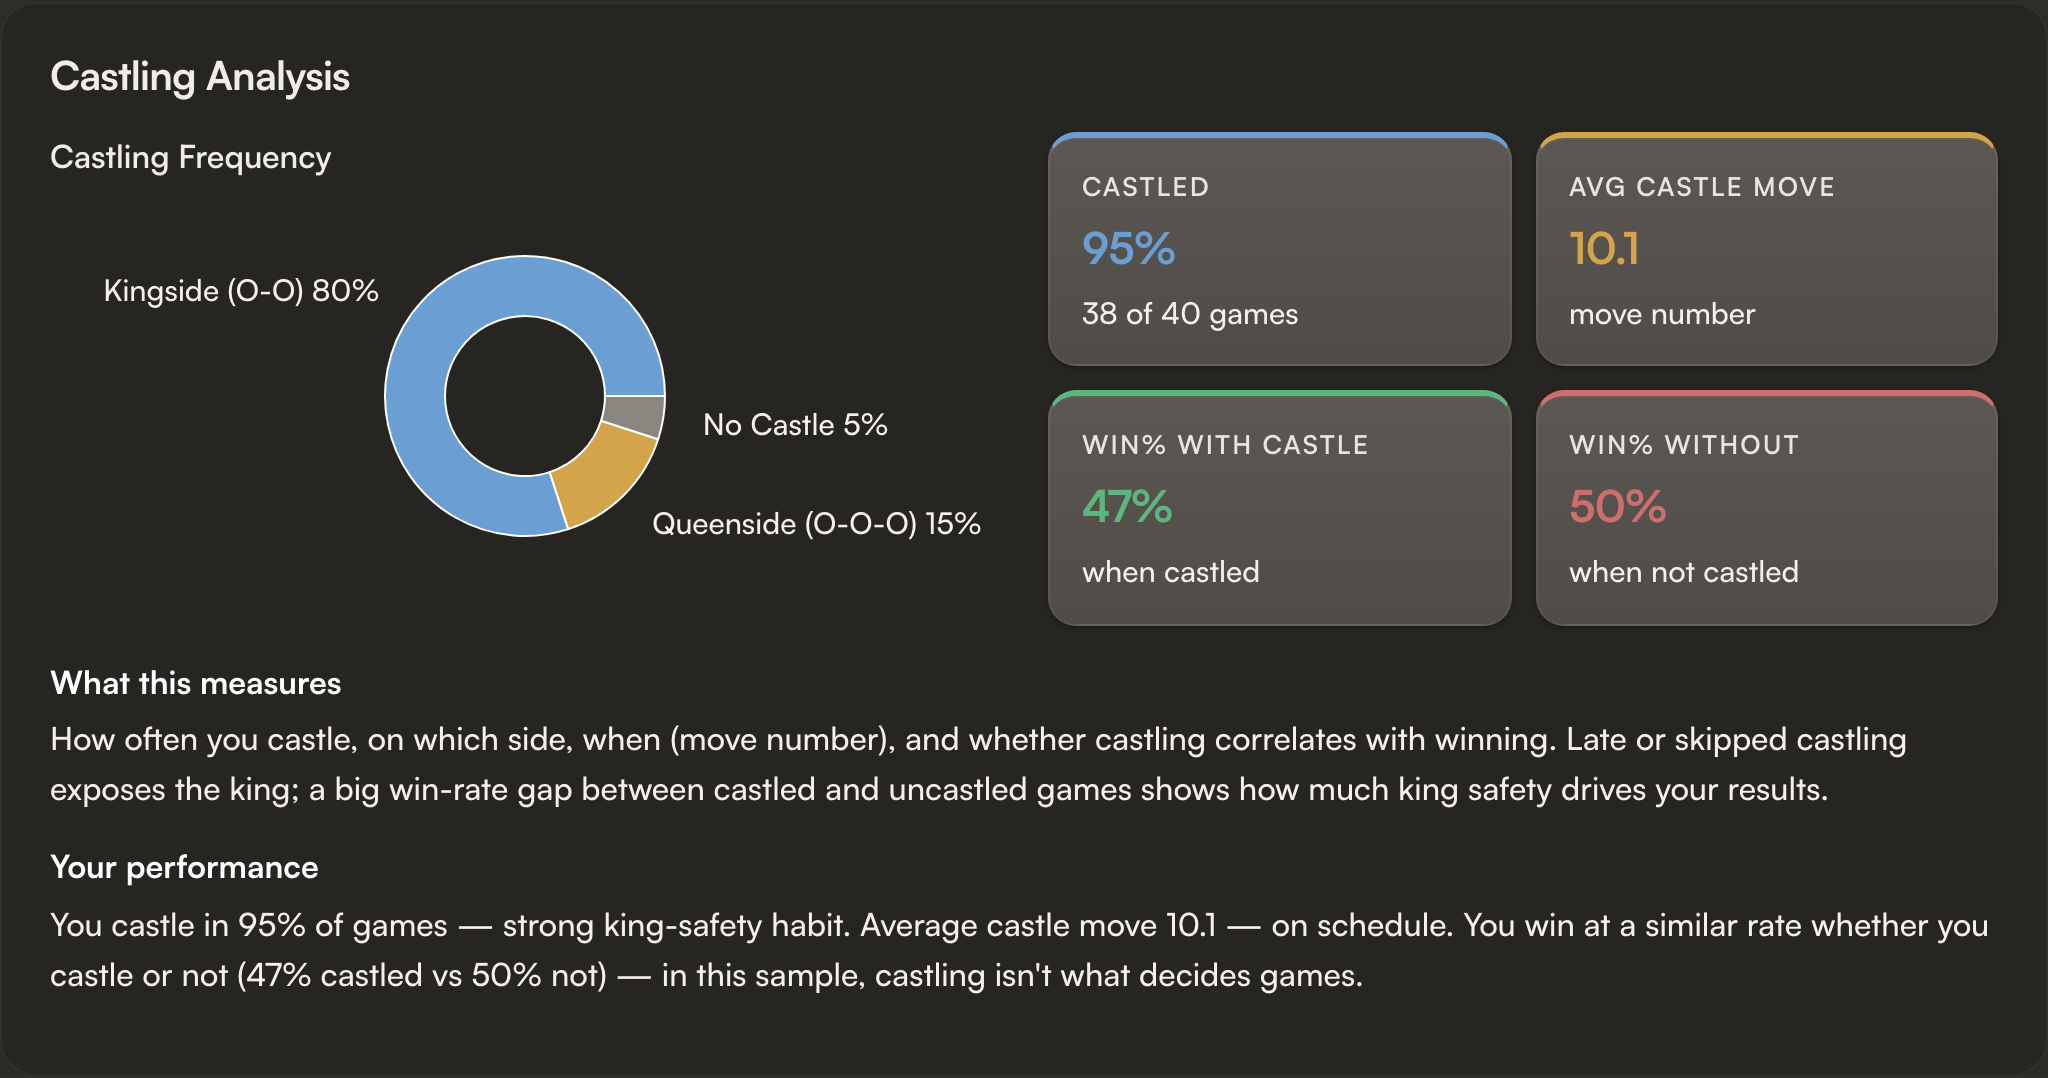
Castling Analysis
Kingside / queenside / never-castled split, average castle move number, and win rates with vs without castling.
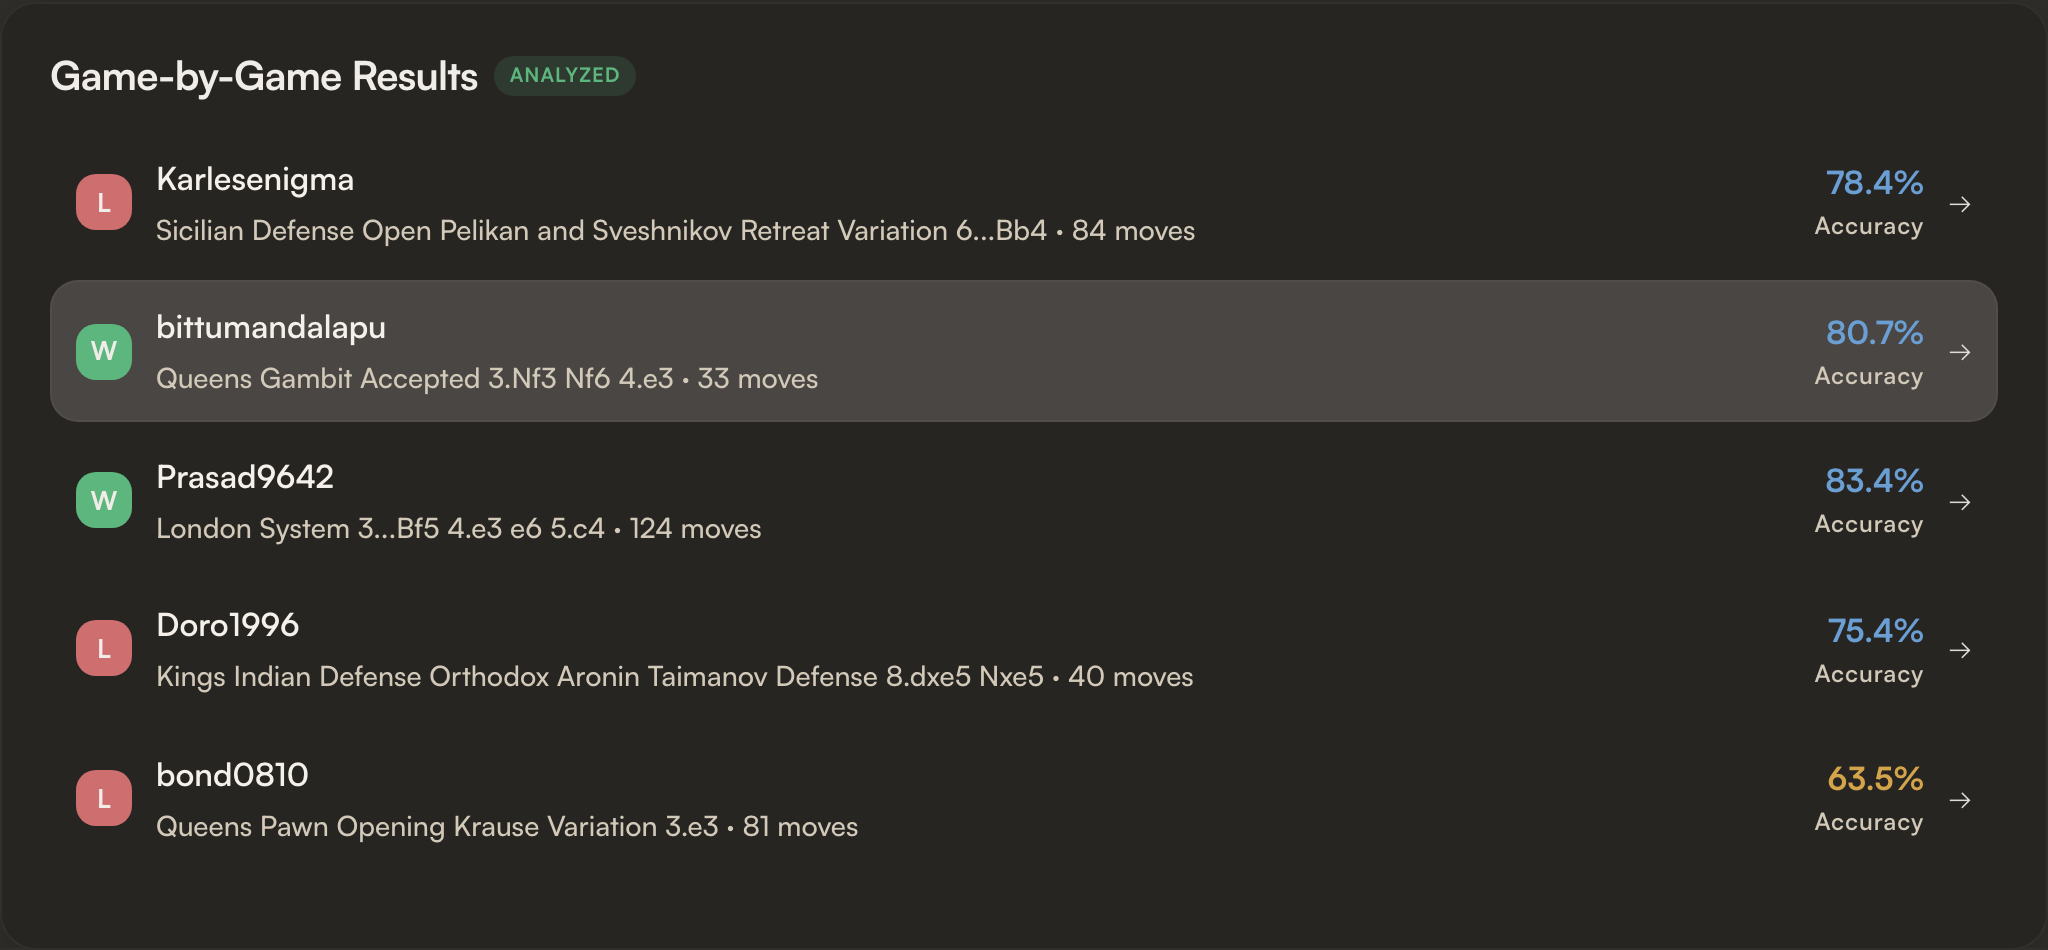
Game-by-Game Results
Every analyzed game as a clickable row. Tap any row to open that game in the full Game Report.
Re-running and history
- Every generated report is saved. The selection screen lists past reports by date, time control, and game count.
- Refresh the latest report to pull in new games without losing the older one.
- Switching time control (Rapid → Blitz) generates a fresh report; both stay accessible.
Where Profile Report fits
The Profile Report identifies which dimension is weak across many games. A Game Report then shows the specific moves where that dimension cost points in a single game, and the Insights dashboard tracks the same metrics over your whole history.
Frequently asked questions
Is the Lumichess Profile Report free?
Yes, free and unlimited. Stockfish 18 runs in your own browser, so there is nothing to pay and nothing is sent to a server.
How many games does it analyse?
Roughly your last 40 rated games in the time control you choose: Rapid, Blitz, Bullet, or All.
What is the Skill Profile?
A radar of six rating-adjusted scores from 0 to 100 (Opening, Tactics, Endgame, Conversion, Time Management, and Resourcefulness), each tagged Strong, Develop, or Weak spot.
How is it different from a Game Report?
A Game Report breaks down one game move by move. The Profile Report finds the pattern across roughly your last 40 games, so you fix the recurring leak rather than one bad night.
Do I need to upload a PGN?
No. Connect a Chess.com or Lichess account, enter a username, pick a time control, and the report builds itself.